Ten things to know about affordable housing in Alberta

Ten things to know about affordable housing in Alberta

Ten things to know about affordable housing in Alberta

People without affordable housing suffer from poor health outcomes, have difficulty finding and sustaining employment and are at greater risk of having their children removed by child welfare authorities.

Here are 10 things to know about affordable housing in Alberta specifically:

  1. The NDP government of Rachel Notley undertook important initiatives pertaining to affordable housing. In its 2016 budget, the Notley government announced the near doubling of provincial spending on housing. This represented a total of $892 million in new funding, spanning a five-year period.
  2. According to the most recent Census, 11.4% of Alberta households experience core housing need, representing more than 164,000 households. In order to assess housing need for Canadians, the Canada Mortgage and Housing Corporation uses a measure called core housing need. A household is said to be in core housing need if, out of financial necessity, they either pay more than 30% of their gross household income on housing, live in housing requiring major repairs, or live in housing with insufficient bedrooms for the household size in question (as determined by the National Occupancy Standards).
  3. Seniors living alone in Alberta face particularly high rates of core housing need. Nearly 34% of senior (65+) females living alone in Alberta were in core housing need in 2011, while the figure for senior (65+) males living alone was just under 26%. 
  4. Female lone-parent households in Alberta also face a particularly high rate of core housing need. More than 27% of these households were in core housing need in 2011. However, that figure likely dropped after the NDP government of Rachel Notley introduced the Alberta Child Benefit, a major feature of the 2016 Alberta budget.
  5. Members of Alberta First Nations also experience very high rates of core housing need. In fact, the rate of core housing need for Status Indians is nearly 25%—more than double the rate for non-Indigenous households in the province. And get this: these core need figures do not account for households living on reserve (if they did, that figure would be much greater). I should also note that more than 25% of  persons experiencing absolute homelessness in Alberta identify as being Indigenous, even though Indigenous peoples make up just 7% of Alberta’s total population.
  6. Housing typically constitutes a larger share of spending for low-income households (compared with middle- and higher-income households). And as the figure below illustrates, that phenomenon got measurably worse for low-income households in Alberta between 2010 and 2016.

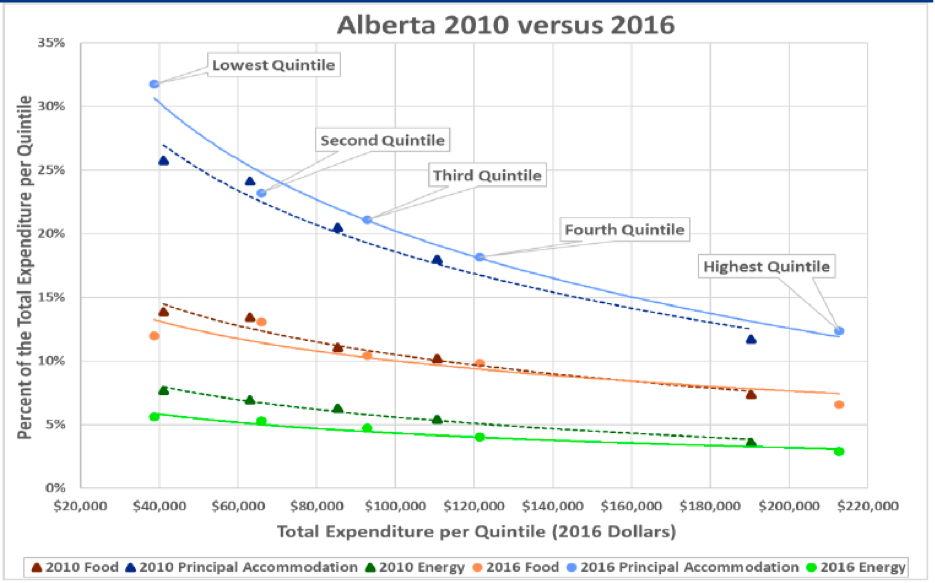
    Source. Kneebone, R., & Wilkins, M. G. (2018). Social Policy Trends: Paying for the Essentials: Shelter, Food and Energy Consumption by Household Income Quintile for 2010 and 2016. The School of Public Policy Publications, 11. Retrieved from Policy School’s website: https://www.policyschool.ca/wp-content/uploads/2018/07/Social-Trends-Engel-Curves-July-2018.pdf

  7. On a per capita basis, Alberta has far fewer subsidized housing units than the rest of Canada. According to the most recent Census, subsidized housing represents just 2.9% of Alberta’s housing units; for Canada as a whole, the figure is 4.2%.
  8. Some Alberta cities have much more low-cost rental housing (per capita) than others. The visual below shows the range of private market rents paid on one- and two-bedroom apartments across Alberta’s seven major cities. The light-coloured bars show the range of rents paid on the second quintile (i.e., the second-poorest quintile) of private market rents. The next darkest bar shows the range of rents paid on the third quintile (i.e., the middle quintile) of rents, while the darkest bars define the range of rents paid on the fourth quintile of rents. Among the seven major cities, Medicine Hat appears to have the most low-cost rental housing units (per capita), and Calgary the fewest.

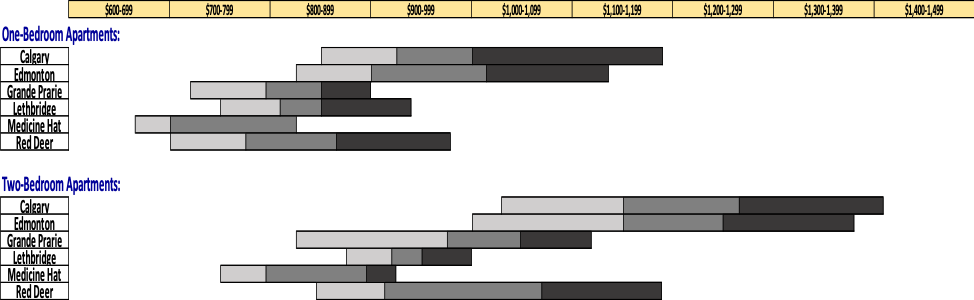
    Notes. Monthly rent quintiles by city in 2017. Data provided to Ron Kneebone (University of Calgary) by Canada Mortgage and Housing Corporation. The range of rents paid on the first and fifth quintiles are not reported due to confidentiality reasons.

  9. Going forward, the impact of the federal government’s National Housing Strategy will be modest. Recent analysis by Canada’s Parliamentary Budget Officer (PBO) projects future federal housing spending to actually decrease over the next decade (relative to Gross Domestic Product). The same analysis projects that total spending on Indigenous housing by Canada’s federal government will be “substantially lower” going forward. (For a general overview of the National Housing Strategy, see this analysis.)
  10. There are considerable cost savings to be realized when investing in affordable housing, especially when the tenants have serious mental health challenges. Subsidized housing for vulnerable subpopulations (including persons with mental health challenges) that is accompanied by professional staff support is referred to as supportive housing. Recent analysis in Calgary estimates considerable cost savings in the health and justice sectors attributable to formerly-homeless persons receiving supportive housing.

In Sum. For a more comprehensive look at affordable housing in Alberta, see this year’s Alberta Alternative Budget (AAB). Full disclosure: I was primary author of the chapter on affordable housing and homelessness.

I wish to thank the following individuals for invaluable assistance with the housing chapter of this year’s AAB: Meaghan Bell, John Kmech, Claire Noble, Chidom Otogwu, Steve Pomeroy, Ron Kneebone, Vincent St. Martin, John Veenstra and one anonymous reviewer. Any errors are mine.

Book review: Understanding spatial media

Book review: Understanding spatial media

Book review: Understanding spatial media

Rob KitchinTracey Lauriault and Matthew Wilson recently co-edited a book titled Understanding Spatial Media. Published by SAGE, this book is about technology, power, people, democracy and geography.

Here are 10 things to know about the book.

1. The book can help us make better decisions pertaining to the acquisition and use of technology and data. Technological advancements happen quickly; this book encourages the reader to think carefully about these changes. It encourages us to think sociologically and technologically at the same time. That’s because technology isn’t neutral; there are politics and values embedded within it. We shape technology, which in turn shapes us.

2. This book matters because homelessness is inherently geographical. As an example, many households currently experiencing homelessness in Calgary used to live in First Nations communities. Understanding what’s driving their ‘flow in’ to Calgary’s Homeless-Serving System of Care is an important part of understanding homelessness in Calgary. Across Canada, rates of child poverty are much higher ‘on reserve’ than ‘off reserve.’ The visual below, taken from this report, makes that point quite clear.

Child Poverty rates graph

3. The book is relevant to Point-in-Time (PiT) Counts of homelessness. Chapter 21 is about spatial profiling; it looks at the action of classifying people and then acting according to that classification. As noted by Calgary Homeless Foundation’s CEO, Diana Krecsy: “The language we use in PiT Counts gets translated into policy discussions.” For example, if communities choose to start counting veterans experiencing homelessness (as has happened in many Canadian communities over the past several years) it can translate into more attention being focused on the housing needs of veterans (which I would argue has also happened).[1] Indeed, categories and definitions used in PiT Counts are not value neutral.

4. Chapter 4, “Digitally Augmented Geographies,” highlights important differences in Internet accessibility globally. Authored by Mark Graham, I found this chapter very readable. Points raised in the chapter include the fact that approximately one-quarter of the world’s population “has still never used the internet” (p. 46). The chapter further notes that, of the approximately 3 billion people in the world who do use the Internet, “many are forced to use it in very restricted ways because of economic necessity (e.g. metered plans, bandwidth caps), technical limitations (e.g. slow connectivity speeds) and government restrictions (e.g. censorship or surveillance)” (p. 46). This is relevant for persons experiencing homelessness, and it’s especially relevant to northern regions of Canada; it’s also an important advocacy area for the Federation of Canadian Municipalities.[2]

5. Chapter 5, “Locative and Sousveillant Media,” discusses the use of smartphones to capture things on video…including things that weren’t intended to be captured on video. Readers learn that approximately two-thirds of the world’s population keeps a smartphone “within arms reach [sic] at all times, reaching for it 150 times per day…” (p. 57). The same chapter includes a discussion of people whipping out their phones and catching ‘incidents of interest’ on video—for me, this brought to mind a May 2017 incident in which a Toronto security guard was caught on camera while throwing objects at a man experiencing homelessness.

6. Chapter 7, titled “Urban Dashboards,” discusses a topic that is very relevant to my work at the Calgary Homeless Foundation (CHF). It notes that, since roughly 1990, the term “dashboard” has denoted “a screen giving a graphical summary of various types of information, typically used to give an overview of (part of) a business organization” (p. 75). It further notes: “Business and urban data displays often mimic the dashboard instrumentation of cards or aeroplanes. Where in a car you would find indicators for speed, oil and fuel levels, here you will find widgets representing an organization’s ‘key performance indicators’: cash flow, stocks, inventory and so forth” (p. 77). Below, readers can see an excerpt from a Calgary community dashboard.

ExternalDashboard_2017_07_05_CROP


This image is an excerpt from a Calgary community dashboard measuring collective impact on specific goals pertaining to homelessness to reach by the end of 2018.

7. Several of the book’s chapters are relevant to research currently being done at CHF. CHF is currently doing some ‘GIS mapping’ research. For clients receiving CHF-funded housing, we’re looking at the postal codes where they came from (before entering Calgary’s Homeless-Serving System of Care) as well as postal codes of the housing units where they end up (once we help house them). Similar research is discussed at various junctures of the book. The book’s co-editor, Dr. Tracey Lauriault, recently explained: “One of aims of the book in general is to give you the ‘critical thinking chops’ needed to do GIS mapping research.”

8. The book touches on many of the same issues discussed at the Canadian Homelessness Data Sharing Initiative. This annual event, co-hosted by CHF and the University of Calgary’s School of Public Policy, discusses infrastructure (i.e. where to store data); modeling and schemas (i.e. rules related to a classification system); analytics (i.e. the use of techniques, statistics and software), access to data, sensitivity (i.e. respecting people); linked data; and transparency. All of these topics are discussed in the book. (I’ve previously blogged about the inaugural data-sharing event here, and I’ve recently blogged about the second annual event here).

9. The authors who contributed to this book represent a diverse collection of scholars.Scholars from 18 universities, spanning six countries, participated in the effort. This is indicative of some impressive professional networking on the part of the book’s three editors—they opened a tent and let a lot of thinkers come inside it. This serves readers well.

10. This book is geared mostly to other researchers in geography and media studies. Most of the book’s intended readers are university professors and upper-level university students. I personally had great difficulty understanding several of the chapters. I even found Chapter 1 to be very difficult (it uses the words ontogenetic, neogeography, multivocal, geovisual and synoptic). I would therefore not recommend this book to people who lack prior knowledge in the realm of spatial media.

I wish to thank the following individuals for invaluable assistance with this blog post:   Vicki Ballance, Rachel Campbell, Chantal Hansen, Patrick Hunter, Diana Krecsy, Tracey Lauriault, Kara Layher, Michael Lenczner, Lindsay Lenny and  Joel Sinclair.  Any errors are mine.


[1] For examples of recent attention to veterans’ homelessness in Canada, see this this Globe and Mail article and this PowerPoint presentation. (I suspect that a variety of factors, not just PIT Counts, have likely led to increased policy attention on veterans’ homelessness in Canada over the past several years.)

[2] You can download a “pre-publication version” of this chapter here, free of charge. You can check out Professor Graham’s web site here, and you can see his contributions to The Guardian here.


You can view a PDF version of this blog post here: Book review- Understanding spatial media 

Second Annual Canadian Homelessness Data Sharing Initiative

Second Annual Canadian Homelessness Data Sharing Initiative

Second Annual Canadian Homelessness Data Sharing Initiative

On May 18, 2017, the Second Annual Canadian Homelessness Data Sharing Initiative took place in Calgary (all slide presentations, as well as photos from the event, are available here). The event was organized by the Calgary Homeless Foundation and the University of Calgary’s School of Public Policy, and the participants included:  people who build datasets (about persons experiencing homelessness); researchers who use that data; persons with lived experience; and public servants.

Here are 10 things to know about this year’s event:

1. For the second year in a row, there was strong representation from Canada’s federal government. Five officials from Employment and Social Development Canada (ESDC) participated, three of whom had formal speaking roles at the event. Aaron Segaert (from ESDC) presented data from more than 200 homeless shelters between 2005 and 2014, showing that:

  • the occupancy rate (i.e. % of beds filled each night) across these shelters rose from 83% in 2010 to 92% in 2014;
  • the average ‘duration of stay’ by households using these shelters is increasing, especially for families and seniors;
  • the number of seniors using homeless shelters annually nearly doubled across Canada between 2005 and 2014.

2. This year’s event had strong Quebec representation. Research presented by Annie Duchesne, for example, finds that certain subgroups of persons in Montreal’s largest homeless shelter are more likely to experience chronic homelessness (i.e. long-term homelessness) than others—those subgroups include persons over the age of 50, persons with mental health problems and persons with disabilities.

3. Indigenous perspectives were presented. Bonnie Healy’s presentation focused on the work of the Alberta First Nations Information Governance Centre. Topics raised in her presentation included First Nations OCAP principles, a publication titled First Nations – Health Trends Alberta, the First Nations health status report for the Alberta region, the work of the Alberta First Nations Governance Centre, and Indigenous logic models.

4. Several data-sharing advocates actively participated in this year’s event. Michael Lenczner, a data-sharing champion in Canada’s social sector, attended and spoke at this year’s event. He stated that, in terms of data sharing, he’s not aware of any other subsector of Canada’s non-profit sector that has an annual forum to discuss the importance of data. He also cited Alberta as a leader in data sharingmaking reference mostly to PolicyWise, who’ve worked with government to link client administrative data from multiple ministries. They’re the leaders of this kind of data-linking in Canada, and possibly the world.

5. Difficulties with researchers accessing federal homelessness data were raised. Tracey Lauriault is a Carleton University professor who described her past difficulties in trying to access HIFIS data for research. When she did, she was told that her data requests must be sent to community coordinators; yet, federal officials were never able to provide her with a list of community coordinators.

6. One of the event highlights was a panel discussion on moving towards increased national integration of Homelessness Management Information Systems (HMIS). As I’ve written before, there are multiple software systems across Canada that keep data on persons experiencing homelessness; many people would like to see increased integration of these systems (possibly into one very large system, or at least the sharing of data among these systems so that researchers can have larger samples for their work). Henry Dagher (ESDC) discussed the evolution of the Homeless Individuals and Families Information System (HIFIS) software system (which is one type of HMIS system). This federally-administered HIFIS system is now operating in more than 100 communities. HIFIS 4 is now web-based and gaining strong momentum; BC Housing is now implementing HIFIS province-wide (spanning approximately 200 service providers). Several panel members suggest that community members need to gain more control of HIFIS (via a stakeholder advisory body with some clout that includes persons with lived experience). As Michael Lenczner puts it: “The tail shouldn’t wag the dog.” Jenn Legate (Calgary Homeless Foundation) raised several operational concerns that need to be kept in mind as we move forward on increased national integration of HIMIS systems—namely, the ongoing costs a server, the cost of migrating data from an old database system to a new system, challenges pertaining to customer service provided by software vendors, and legal barriers to data sharing.

7. Important findings were presented from Canada’s recent nationally-coordinated Point in Time Count of homeless persons. Patrick Hunter’s presentation noted that more than 25% of homeless persons enumerated during the 2016 count did not use an emergency shelter during the previous year—I think this speaks in part to conditions in emergency shelters, about which there’s virtually no research.[1] Hunter also reported that Indigenous peoples are nine times more likely to experience homelessness than the rest of Canada’s population; what’s more, more likely to experience longer homeless spells than non-Indigenous people.

8. One of the event highlights was a “review of the day” by Stephen Metraux. Metraux, the Director of the Health Policy Program at the University of the Sciences in Philadelphia, gave a ‘wrap up’ presentation that included a short slide presentation. He subsequently wrote a blog post in which he reflected on his experience at the event.

9. Several suggestions were made about a ‘way forward.’ Topics that need to be tackled in the future include:

10. This will continue to be an annual event that we expect to be held each year in (or near) Calgary. It may also evolve into a two-day format, with one day focusing on the operational aspects associated with building, maintaining and improving HMIS systems. All of these operational matters are the focus of this biannual event in the United States; yet, no Canadian equivalent currently exists.

In Sum. We hope this annual event will help communities across Canada get closer to ending homelessness. The event web page—with slide presentations and minutes from the event—can be found here.

A blog post written about the First Annual Canadian Homelessness Data Sharing Initiative can be found here.

The author wishes to thank the following individuals for invaluable assistance with this blog post: Vicki Ballance, Ron Kneebone, Eric Latimer, Tracey Lauriault, Kara Layher, Michael Lenczner, Lindsay Lenny, Stephen Metraux and one anonymous source. Any errors lie with the author.


[1] This 2016 report on conditions inside Out of the Cold facilities and Warming Centres is worth reading. However, it should be noted that the facilities that are the focus of this report are not “homeless shelters” as defined by City of Toronto officials; rather, they operate separately from the formal shelter system.


You can view a PDF version of this blog post here: Second Annual Canadian Homelessness Data Sharing Initiative


Ten Things to Know About Social Assistance in Canada

Ten Things to Know About Social Assistance in Canada

Ten Things to Know About Social Assistance in Canada

The present blog post is the first in a two-part series on social assistance. (Part two, which looks at social assistance in Alberta, can be viewed here). The series is inspired by recent data captured in Alberta’s 2016 Point-in-Time Count of Homelessness suggesting that just a small percentage of persons experiencing homelessness in Calgary receive social assistance (see point #7 of this previous post).

Ron Kneebone (Professor of Economics at the University of Calgary) and Katherine White (Yukon’s Deputy Finance Minister) have referred to social assistance as “the final layer of the public social safety net — designed to catch those people in need of support but unable to find it from family, friends or non-government agencies…”

(I’d argue that, in larger urban centres, social assistance is in fact the second-last layer before the homeless-serving sector…)

Here are 10 things to know:

  1. Every Canadian province and territory has its own social assistance system—that is, its own legislation, its own regulations and its own policies.First Nations with self-government agreements have their own “income assistance” programs. And for First Nations without self-government agreements, income assistance is funded by Indigenous and Northern Affairs Canada (but “aligned with the rates and eligibility criteria for off-reserve residents of the reference province or territory”).[1] In the words of Martin Papillon (Associate Professor of Political Science at the University of Ottawa): “First Nations administer income assistance on behalf of federal authorities, yet they follow rules and objectives established by provinces.”[2]
  2. There aren’t enough jobs to go around,[3] and it’s well-known that Employment Insurance benefits provide only temporary coverage (and only cover a small percentage of jobless persons).[4] Without social assistance, many people without jobs would be destitute. This places elected officials and public servants in a conundrum—while wanting to provide some basic income assistance for those without work, they don’t want to ‘make life so comfortable’ for those persons so as to discourage them from actively looking for work. They also don’t want workers to quit their jobs in the belief that social assistance provides a ‘good living.’ In other words, by design, social assistance has two contradictory objectives: 1) to give people enough money to live on; and 2) to not give people enough money to live on.
  3. In Canada, social assistance coverage expanded in the post-World War II era; it then contracted in the 1980s and 1990s. In the years following World War II, Canada experienced low unemployment, high levels of tax revenue and a strong feeling of collective solidarity. During this time, senior orders of government designed and funded a social assistance system with benefit levels and rules that were generous relative to today.[5] From the mid-1960s until the mid-1970s, this expansion was especially fast.[6] (For more on the political and economic factors that led to the post-1970s contraction, see this 2014 article by Jim Stanford.)
  4. Most people agree that social assistance benefit levels are insufficient to live on. Across Canada, 70% of households on social assistance are “food insecure.” In fact, it’s rare to see an elected official or senior public servant even attempt to make a case that social assistance benefit levels are sufficient. In 1995, an Ontario provincial cabinet minister attempted to do this; he was roundly ridiculed. In Alberta, a “single employable adult” on social assistance receives approximately $8,000 annually to live on. (To see social assistance benefit levels for yourself, check out the most recent Welfare in Canada)
  5. Very few immigrants (relative to Canada’s general population) receive social assistance.That’s a finding of research done by Tracy Smith-Carrier and Jennifer Mitchell (and that research is presented in Chapter 17 of this 2015 book on social assistance in Canada). However, a very large percentage of members of First Nations receive “income assistance” (this issue is discussed in detail by Martin Papillon in Chapter 18 of the aforementioned book).
  6. In recent years, there’s been a substantial increase in persons with disabilities receiving social assistance. At a national level, John Stapleton and Anne Tweddle have written about this here. They find this increase to be especially apparent in Ontario, Manitoba, Alberta and British Columbia (and they find it to be most pronounced in Alberta). For a recent review of what this trend looks like in Alberta, see this recent report.
  7. The inadequacy of social assistance puts a strain on other parts of Canada’s social welfare system. Three specific points are worth making here. First, if social assistance benefit levels were higher, there would be less demand for emergency shelter beds (that’s one of the findings of this recent report). Second, most of the government funding required for social housing in Canada is for the “rent supplement” component of the assistance (i.e. financial assistance to cover the gap between what it costs the operator to pay for the housing, on the one hand, and what a low-income household can afford, on the other). There’d be less need for social housing funding if social assistance benefit levels were higher. Third, low income is associated with poor health outcomes,[7] which in turn lead to higher health care costs. It’s therefore likely higher social assistance benefit levels would reduce health care costs in Canada.
  8. Many landlords discriminate against tenants who report social assistance as a source of income. This is commonly known by both social assistance recipients and their advocates. And in 2008, this theory was put to the test in a study where ‘mock phone calls’ were made to Toronto landlords; during the study, researchers found solid empirical support for the claim that landlords do indeed discriminate against social assistance recipients.
  9. Social assistance administrators do not track what happens to people who are denied coverage. In other words, when a person’s application for social assistance is rejected, there’s no systematic effort made to track what happens to them. However, researchers do sometimes look at what happens after people stop receiving social assistance; one such Canadian study is available here.
  10. A modest increase in social assistance benefit levels would likely reduce homelessness. A recent report estimates that modest increases in social assistance benefit levels would likely result in less need for emergency shelter beds for homeless persons. Specifically, the report suggests that a 15-20% increase in benefit levels for ‘single employables’ would likely result in a 15-20% decrease in demand for shelter beds.

In Sum. Across Canada, social assistance plays an important, but insufficient, role in poverty alleviation. Higher social assistance benefit levels would likely result in tangible outcomes, including less food insecurity, improved health outcomes and less homelessness. Part 2 of the present blog series will focus on the Alberta context.

The author wishes to thank Daniel Béland, Gerry Boychuk, Pierre-Marc Daigneault, Louise Gallagher, Seth Klein, Jennefer Laidley, Kara Layher, Lindsay Lenny, Michael Mendelson, Dionne Miazdyck-Shield, Munir Sheikh, Anne Tweddle and Donna Wood for invaluable assistance with this blog post. Any errors lie with the author.


Download a PDF of this blog post here: Ten Things to Know About Social Assistance in Canada


[1] An important exception is Ontario, where the provincial government is responsible for on-reserve income assistance. Martin Papillon briefly discusses this in Chapter 18 of this book.

[2] I’ve taken this quote from p. 334 of this book.

[3] For more on the relationship between the labour market and social assistance receipt, see Gerard Boychuk’s chapter in this 2015 book. Figure 2.2 in the chapter consists of a line graph suggestive of a strong correlation (R2 = – 0.88) between the percentage of Canada’s adult population receiving social assistance, and the employment rate, over time.

[4] For more on the inadequacy of Employment Insurance benefits, see the Employment Insurance chapter in the 2017 Alternative Federal Budget.

[5] This happened as part of an expansion of Canada’s entire social welfare system. For more on this, see this book by Dennis Guest.

[6] To learn more about this history, check out my PhD thesis, which can be downloaded here.


[7] This 2009 report, focusing on the Ontario context, looks specifically at health outcomes of social assistance recipients.


Public Policy and Homelessness: The Case of Calgary

Public Policy and Homelessness: The Case of Calgary

Public Policy and Homelessness: The Case of Calgary

On January 24, I gave a presentation to students at the University of Calgary as part of the Certificate in Working with Homeless Populations program. The goal of this presentation was to convey the fact that public policy strongly impacts the number of homeless people in a given jurisdiction at any particular time.

A version of my PowerPoint slides, which are chock-full of visuals and references, can be downloaded here: Falvo Public Policy and Homelessness WHP 1 of 3 

This is Part 1 of a 3-part presentation I gave that day. A blog post based on Part 2 can be found here, while a blog post based on Part 3 can be found here.

Here are 10 things to know:

1. Federal spending in Canada fell drastically from the early 1990s until the mid-2000s. In the early 1990s, federal spending (not counting intergovernmental transfers) represented 19% of our Gross Domestic Product (GDP). By the late-2000s, that figure had dropped to about 13%. That’s a remarkably sharp drop in such a short time.

2. Taxation fell sharply in Canada between the mid-1990s and the late-2000s. Looking at annual tax revenue expressed as a percentage of GDP (all orders of government combined) tax revenue in Canada represented 36% of GDP in the late-1990s.  By 2012, that figure had dropped to below 31%. What’s more, Canada’s level of taxation was considerably above the average for OECD countries in the mid-1990s; today, our taxation level is well below the OECD average.

3. Federal spending on housing decreased substantially beginning in the early 1990s. In light of the trends discussed in points #1 and #2 above, this comes as little surprise to most people. For more on the federal role in housing policy, including a look at how it has evolved over the past several decades, see this 2013 conference paper.

4. Rental housing production in Canada fell sharply beginning in the late 1970s. This happened in part due to reductions in public spending on housing discussed in point #3 above. Other factors that likely led to this drop include high interest rates (which made it expensive for developers to finance new supply), a shrinking middle class (which resulted in less demand for rental units), provincial legislation pertaining to condominiums, and rent regulation.[1]

5. Beginning in the mid-1990s, the Alberta government began spending substantially less on housing.This decrease was drastic. Indeed, in 1995, the Alberta government devoted an amount worth 0.36% of its GDP to housing; just five years later, this amount had shrunk to a mere 0.10%. The Alberta government’s annual spending on housing didn’t start to increase again until the early 2000s.

6. In 1993, the Alberta government introduced strict reforms to social assistance. This entailed at least two things.  First, the rules changed, meaning that provincial officials made it much more difficult for Albertans to qualify for social assistance. Second, the annual value of benefit levels for those who did qualify for social assistance dropped quite suddenly (and then continued to erode over time).  Indeed, a ‘single employable adult’ without dependents received almost $9,000 annually in 1992 (that figure includes tax credits); by 2007, this figure had shrunk to less than $6,000[2]  That’s a very sharp loss in annual income for a very low-income individual.

7. Alberta has much less rental housing than other provinces, and this gap has grown in the past 25 years. In 1990, Alberta had almost as many apartment rental units (on a per capita basis) as the rest of Canada.  Then, beginning in the early 1990s, the amount of apartment rentals in Alberta started to decrease; today, Alberta has just half the number of apartment rental units (per capita) as the rest of Canada.  There are three main reasons for this: the first being, historically, Alberta experienced higher rates of in-migration than other provinces; secondly, the Alberta government was not as keen as other provinces to subsidize housing for lower-income households; and lastly, Alberta has a relatively large number of high-income households (and higher-income households typically prefer to own than rent).

8. Calgary has much less rental housing than Edmonton, and this gap has grown since the mid-1990s. Beginning in the early 1990s, the number of rental housing units (per capita) in both Edmonton and Calgary started to drop each year; and it dropped more sharply in Calgary than in Edmonton. Today, Calgary has approximately half the number of rental units as Edmonton on a per-capita basis.

9. The many public policy factors raised above helped create the ‘perfect storm’ for a very sharp rise in homelessness in Calgary beginning in the mid-1990s. From the mid-1990s until the mid-2000s, homelessness in Calgary saw very rapid growth.  For example, according to analysis done with Point-in-Time Count methodology, it grew by almost 700% (per capita) during that time. And while it’s always hard for researchers to establish causation (see point #2 of this blog post) it can reasonably be inferred that the public policy changes discussed above played a major role in this increase.

Part1, Slide 19

10. In 2008, Calgary became the first Canadian city to develop a plan to ‘end homelessness’; since that time, homelessness in Calgary has decreased. There are three main reasons for that decrease. First, since 2008, a great deal of progress has been made at the community level in Calgary (I’ve previously discussed the very important role played by the Calgary Homeless Foundation as System Planner here). Second, benefit levels for Alberta social assistance recipients have increased since 2008.  For example, total annual income received by a ‘single employable’ household receiving social assistance jumped by more than 30% in 2009; and total annual income for a single adult receiving Assured Income for the Severely Handicapped increased by 30% between 2011 and 2013. Third, Calgary’s rental vacancy rate is very high right now (an indirect result of the drop in the price of oil).

In Sum: The intended ‘take away’ from the presentation is that, homelessness is a complex issue that requires a coordinated and collective response that addresses the local issues through local responses. When it comes to ending homelessness, a community plan that is focused on increasing coordination and collaboration across a system of care and greater integration with big system public service providers is vital. For agencies at the frontline, having a System Planner, such as the Calgary Homeless Foundation, providing the big picture view and coordination matters a great deal… and so too does public policy.


I wish to thank: Rachel Campbell, Louise Gallagher, Ron Kneebone, Kara Layher, Lindsay Lenny, Chidom Otogwu, Steve Pomeroy, Joel Sinclair, John Stapleton, Greg Suttor, Alina Turner and Donna Wood for assistance with this.  Any errors are mine.

[1] This is not to suggest that rent regulation doesn’t play an important role in regulating landlord-tenant relations.  For more on this, see this recent analysis.

[2] Both figures in this paragraph are expressed in 2015 constant dollars.


For a PDF version of the present blog post, please click here: Public Policy and Homelessness,The Case of Calgary