Ten things to know about subsidized rental housing in Alberta

Ten things to know about subsidized rental housing in Alberta

Ten things to know about subsidized rental housing in Alberta

On February 27, the UCP Government of Jason Kenney will table its second budget. With that in mind, here are 10 things to know about subsidized rental housing in Alberta:

  1. Housing need has been increasing in Alberta. The percentage of Alberta households in core housing need has been rising steadily over the past three Census periods. In 2006, 10.1% of Alberta households were in core housing need; by 2011, this figure had risen to 10.7%; and in 2016, the figure stood at 11.4%. In 2016, this represented more than 164,000 Alberta households.
  1. Some household types face especially dire circumstances. Across Alberta, 30.6% of female lone-parent families are in core housing need, while 30.8% of seniors living alone are in core housing need. Further, the rate of core housing need for Status Indians is more than double the rate for non-Indigenous households (and these figures do not account for households living on reserve).[1]
  1. More than one in four persons experiencing absolute homelessness in Alberta is Indigenous. That’s according to Alberta’s 2018 Point-in-Time Count. It’s worth noting that Indigenous peoples make up just 7% of Alberta’s total population.
  1. On a per capita basis, Alberta has far fewer subsidized housing units than the rest of Canada.[2] According to the most recent Census, subsidized housing represents just 2.9% of Alberta’s housing units; for Canada as a whole, the figure is 4.2%.
  1. Comparing Alberta to British Columbia is instructive. As can be seen below, from 2007 until 2010, Alberta produced more housing units funded unilaterally by the provincial government than BC on an annual basis. But since 2011, BC has been outperforming Alberta in that respect. In fact, in 2017, BC’s provincial government funded more than 15 times as many housing units than Alberta, despite having a roughly similar overall population, and despite Alberta having an NDP government at the time.[3]
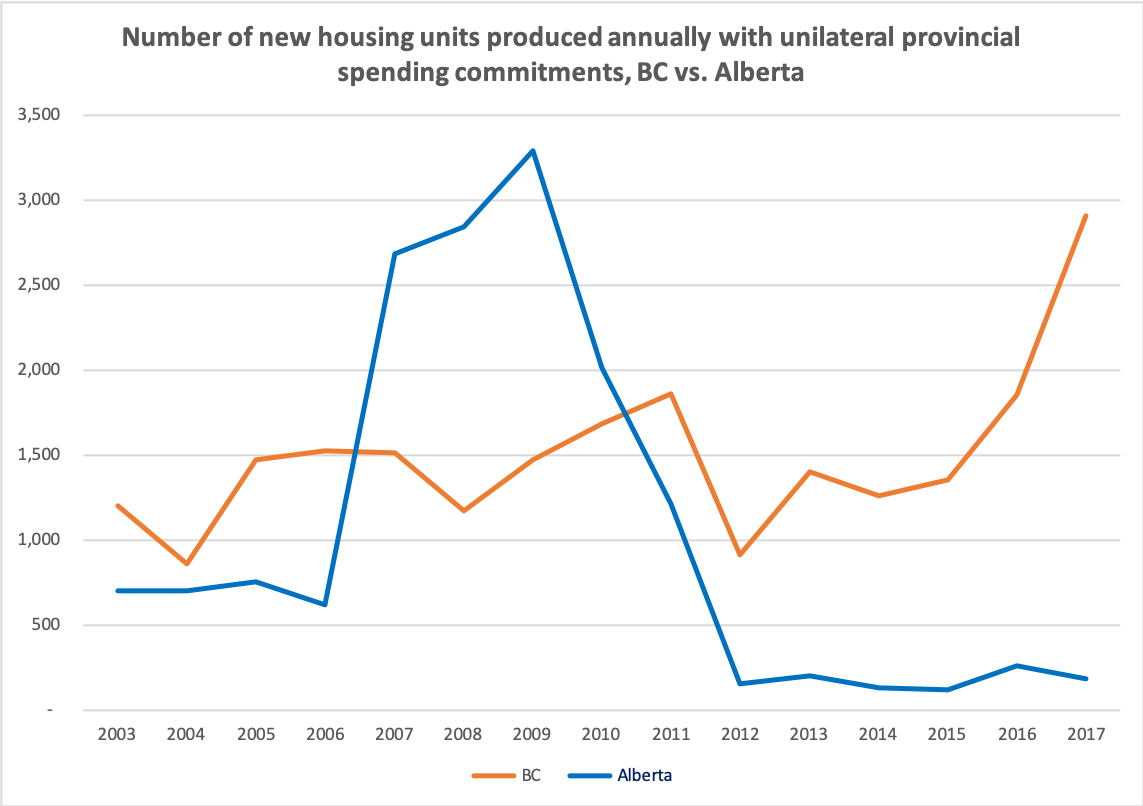
Note. Figures compiled by David Macdonald and Greg Suttor using provincial reporting. Figures only include unilateral provincial spending, and do not include cost-shared initiatives.

  1. The impact of Canada’s National Housing Strategy will be modest. Recent analysis by Canada’s Parliamentary Budget Officer projects future federal housing spending to actually decrease over the next decade (relative to GDP). The same analysis projects that total spending on Indigenous housing by Canada’s federal government will be “substantially lower” going forward.
  1. When Alberta’s provincial government does fund new subsidized units, the process lacks transparency. Even when Rachel Notley’s NDP government was in power, housing funding was not allocated via a formal grant program through which non-profits (i.e., community housing/non-market housing providers) could apply for funding. Such a process has not been in place in Alberta since 2012.
  1. The Government of Alberta lacks a clear, public reporting structure for provincially-subsidized housing. For example, most Albertans—including very well- placed sources in the affordable housing sector—do not know: how much recent funding was used for repairs vs. new builds; how much of this funding has been dependent on cost-matching from other orders of government; what types of projects have received the funding; which types of households have been targeted; or to which municipalities the funding has flowed. This lack of transparency makes it very challenging for key actors in the non-profit housing and homeless-serving sectors to plan; it has also made it virtually impossible for key players in the sector to have a democratic dialogue about how public dollars are being allocated.
  1. In October 2019, the UCP government unveiled its first budget, announcing some housing cuts. Starting in 2020, operating budgets for Housing Management Bodies (HMBs) will be reduced by an average of 3.5%. There will also be a 24% reduction to the Rental Assistance Program, which provides financial assistance for low- to moderate-income households to assist with monthly rent payments for up to one year. This 24% reduction begins in 2020 and takes full effect within three years.
  1. There has been long-time speculation that the recent provincial funding reduction (or a portion of it) may be retargeted and used to match federal funding through the new Canada Housing Benefit. That program, set to take effect 1 April 2020, requires that the Government of Alberta match federal funding.[4] This speculation was confirmed in a 26 December 2019 Canadian Press article.

In sum. There is need for both more subsidized rental housing in Alberta and more transparency at the provincial level. In its upcoming provincial budget, the Jason Kenney government has the opportunity to address both issues.

Acknowledgements. I wish to thank the following individuals for invaluable assistance with this blog post: Zain Abedin, Damian Collins, Martina Jileckova, Jonn Kmech, Ron Kneebone, David Macdonald, Jedd Matechuk, Katrina Milaney, Jeff Morrison, Jenny Morrow, Steve Pomeroy, John Rook, Greg Suttor, Vincent St-Martin and one anonymous source. Any errors are mine.

[1] Rates of core housing need are not calculated in many of Canada’s First Nations communities, largely because in order to calculate core housing need, one must know the cost of market housing (which often does not exist in First Nations’ communities).

[2] According to Statistics Canada’s 2016 Census of Population, subsidized housing “includes rent geared to income, social housing, public housing, government-assisted housing, non-profit housing, rent supplements and housing allowances.”

[3] According to the 2016 Census, Alberta had a total population of 4,067,175, while BC had a total population of 4,648,055.

[4] The Canada Housing Benefit is expected to provide an average of $2,500/annually, per eligible household, to Canadians in housing need.

My review of Robert Clark’s book on Canada’s prisons

My review of Robert Clark’s book on Canada’s prisons

My review of Robert Clark’s book on Canada’s prisons

Clark, R. (2017). Down inside: Thirty years in Canada’s prison service. Fredericton, NB: Goose Lane.

Robert Clark has written a very good book about his 30 years working in Canada’s prison system. Mr. Clark worked from 1980 until 2009 in seven different federal prisons, all located in Ontario. The book, a compilation of personal accounts based on the author’s various assignments, appears both balanced and concise (though it only discusses male prisoners and federal institutions).

Since prisons can be a pipeline into homelessness, I’ve reviewed the book with great interest.

Here are 10 things to know:


  1. Many of Canada’s prisoners are victims of child abuse. According to the author: “Most of the prisoner files I read contained histories of physical, emotional, and, often, childhood sexual abuse” (p. 16).This often led to child welfare interventions and then incarceration in youth facilities.
  1. Nearly 40% of federal prisoners have serious mental health challenges, and this is exacerbated by solitary confinement (formally known as administrative segregation).[1] Prisoners in solitary often have no idea when their time in there will end. Solitary can be very detrimental to a prisoner’s already-fragile mental health and can cause them to be suicidal. The 1996 Arbour Commission of Inquiry examined the impact of solitary confinement in detail.
  1. Many of Canada’s prison staff do outstanding work. For example, the author felt he had “hit the jackpot” when he arrived at Pittsburgh Institution (p. 216). On a personal note, I was touched to see the author single out my late uncle John Van Luven as being part of a group of four parole officers there who were “knowledgeable, professional, and self-motivated” (p. 216). 
  1. Many of Canada’s prison staff do not do outstanding work. According to the author, “too few prison employees care about the prisoners under their care, other than to make sure they are alive and behaving. Any interest in a prisoner’s well-being and their chances for becoming a law-abiding citizen is almost non-existent” (p. 16). One of the author’s colleagues used to say: “I just treat them all like they’re doing a hundred years for rape” (p. 124)! 
  1. Solidarity among staff can be excessive. Most prison staff are extremely reluctant to snitch on their colleagues—and this reluctance is known as the blue wall. Some such solidarity is very pronounced among staff in the face of management, and some staff maintain such solidarity even after they become managers. This is almost identical to the understanding that prisoners have among one another, whereby being labelled a ‘rat’ or a ‘snitch’ can come with severe consequences.
  1. Not every Canadian prison is the same. The book has considerable praise for the Regional Reception Centre at Sainte-Anne-des-Plaines, Quebec. It notes, “while newcomer prisoners in Ontario languished under twenty-three-hour lockup, each new prisoner in Quebec was put through a series of academic and vocational aptitude tests that assisted staff at the next institution in guiding the prisoner’s time and energy” (p. 117). 
  1. Sometimes a specific prison can develop a bad culture. According to the book, this occurred at the now-decommissioned Kingston Penitentiary, where staff stopped enforcing many rules. When the book’s author started working there in 1997, he noticed that prison cells contained items they weren’t supposed to—in one case, a 25-metre extension cord—and that staff had simply stopped caring. (In this particular case, the author attributes much of the bad culture to a management decision to have uniformed staff work consecutive 16-hour shifts.) 
  1. Corruption at Kingston Penitentiary was eventually exposed through an RCMP investigation known as Operation Correct Zero. As a result of the investigation, five guards were terminated for various criminal offences, including drug dealing. In addition, three other guards committed suicide during the course of the investigation.
  1. I wish the book had dealt more with harm reduction in Canada’s prisons. Harm reduction focuses on reducing harm caused by drug use without requiring total abstinence. For example, it can include the distribution of condoms and unused syringes. There is an important body of evidence supporting the view that harm reduction approaches reduce the risk of transmission of blood-borne diseases and prevent overdoses. It is further estimated that HIV rates in Canada’s federal prisons are 10 times higher than in the general population, and Hepatitis C 30 times higher.
  1. I wish the book had included more of an intersectional analysis. I found that the book contained insufficient attention to the unique situations—and overrepresentation—of racialized persons (including First Nations, Inuit and Métis people) in Canada’s prisons. I also think the book could have further explored the unique experiences facing trans persons in prisons.[2]

    In Sum.
    If you’re interested in learning more about conditions inside Canada’s prisons, I strongly suggest you read this book. For people interested in the role played by corrections in leading people into homelessness, the book will be especially worthwhile. I also suggest you listen to this 28-minute podcast, where the author is interviewed by the CBC’s Michael Enright.


I wish to thank the following individuals for assistance with this review: Robert Clark, JT Falvo, Susan Falvo, Craig Jones, Amber Kellen, Katrina Milaney, Amanda Moss, Angela Regnier, Jonathan Robart, Vincent St-Martin, and three anonymous sources. Any errors are mine.

[1] Such statistics can be found in the annual reports of the Office of the Correctional Investigator, available here.

[2] A primer on intersectional analysis can be found here.

Ten things to know about poverty measurement in Canada

Ten things to know about poverty measurement in Canada

Ten things to know about poverty measurement in Canada

On October 29, I gave a guest presentation to Professor Filipe Duarte’s master’s seminar class at the University of Windsor. The topic of my presentation was poverty measurement in Canada.

Here are 10 things to know.

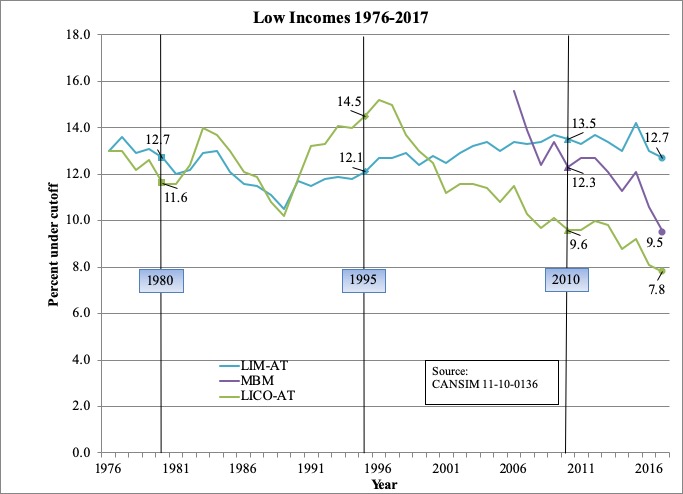
  1. Use of the Low-Income Cut-Off (LICO) would suggest that poverty in Canada has decreased dramatically since the mid-1990s. LICO focuses on the amount of money spent by a family on ‘necessities’ (i.e., housing, food and clothing) as determined by a group of federal public servants. If a family is spending a substantially higher percentage of their income on such necessities—e.g., 20 percentage points higher than the average Canadian family—then the family in question falls below the LICO. The LICO was supposed to be recalculated on a regular basis to reflect changes in spending patterns, but that hasn’t happened since 1992 and is one likely reason for the reduction in poverty shown by this measure (having said that, the LICO has been adjusted each year for inflation). Today, very few experts take the LICO seriously.
  2. Use of the Low Income Measure (LIM) would suggest that poverty in Canada has seen mild fluctuations since the mid-1990s. LIM’s focus is on the family’s income, not on what they spend. A family whose income is below 50% of the national median income (adjusted for family size) is said to be poor according to this measure. LIM, in effect, measures income inequality among the bottom half of income earners. The LIM is useful for international comparisons (though it is far from perfect in that regard, as it looks only at income, not the availability of social programs). 
  3. Use of the Market Basket Measure (MBM) suggests that Canada has seen a major decrease in poverty over the past decade. With the MBM, public officials figure out the cost of a basket of goods and services they feel is sufficient for a standard of living “between the poles of subsistence and social inclusion.” Calculations are then made about how much such a basket costs (the cost of this basket has been estimated for 50 regions across Canada). The content of this basket is periodically adjusted, the last time being in 2011, and its value gets adjusted each year for inflation. If you’re poor according to the MBM, it’s because experts believe you could not afford that basket of goods in your community.

    Visual courtesy of Kevin Milligan.

  4. One of the LICO’s shortcomings is that it doesn’t do a good job of accounting for regional variations in the cost of living across Canada. The LICO (as mentioned above) also hasn’t been adjusted since 1992, meaning that it doesn’t currently account for how much things cost today or what people spend money on today (as Andrew Jackson notes, it doesn’t include the cost of Internet). Finally, LICO doesn’t easily allow for international comparisons. 
  5. One of the LIM’s shortcomings is that it can suggest that recessions are good for poverty reduction. As Alain Noël notes, the LIM is “sensitive to changes in the median income, which sometimes produces counterintuitive results. In a recession, for example, when the median income is flat, the poverty rate may seem to be decreasing while unemployment and economic hardship are increasing.” What’s more, the fact that LIM is based on national median income—as opposed to the median income for the province or territory in question—seems arbitrary to many. Indeed, Professor Noël further notes that “real median incomes vary considerably from one province to another.”
  6. Of the three major indicators, my own preference is the LIM. First, it avoids the inherent challenge of deciding what constitutes an appropriate a basket of goods and services in a country of 37 million people, spanning 10 million km2 and six time zones. Second, I think relativity is what’s really important here—if median income across Canada is increasing, then so too should everyone’s (and vice versa). Third, the LIM lends itself well to international comparisons. I’d like to see it calculated based on national median income for international comparisons, and also based on median income for the economic region in question, in order to provide a more meaningful number.
  7. The debate within Canada has largely ignored the need for indicators of assets. This point has been made by David Rothwell and Jennifer Robson, who note that income and assets are not always correlated. For example, a low-wage worker might have an income that brings them above the LIM, but they may also have $75,000 in student loans and credit card debt. Conversely, a senior could be relying exclusively on Old Age Security as a source of income while also owning a $2 million home outright. (Monitoring asset poverty might put pressure on provincial and territorial officials to stop discouraging asset accumulation among social assistance recipients.)
  8. It’s also important to directly measure material deprivation. For example, core housing need measures the affordability, suitability and adequacy of a person’s housing. Likewise, food insecurity measurement directly assesses the inadequacy or insecurity in access to food due to financial challenges. It’s also important to assess who has access to high-quality childcare and prescription medication. (For a critical analysis of the need to directly measure material deprivation, see this 2017 conference paper.)
  9. In August 2018, Canada’s federal government announced its formal adoption of the MBM as its official poverty measure. Its poverty reduction strategy also unveiled a dashboard of poverty-related indicators. This seems very much in line with a position taken by Peter Hicks in a recent blog post, in which he calls for “an evolving ‘dashboard’ of carefully selected indicators would be more useful than a single measure.” The new federal strategy will use the MBM to monitor progress—importantly, it will not use the MBM to determine program eligibility.
  10. Seniors make for an interesting case study here. According to the LIM, a great many seniors in Canada currently experience poverty. But according to the MBM, very few seniors in Canada currently experience poverty. As Andrew Jackson pointed out last year: “There is a huge difference between the LIM and MBM poverty rates for seniors (14.3% vs 5.1% in 2015.)” And this raises an important question: if Canada’s official poverty measure suggests there’s very little seniors’ poverty, to what extent will Canada’s federal government prioritize assistance for seniors?

In sum. The Trudeau government deserves praise for unveiling a dashboard of poverty indicators that will hopefully receive close attention from federal officials in partnership with provincial, territorial and municipal officials, as well as researchers and advocates. Having said that, Ron Kneebone reminds me that the MBM has yet to be formally adopted by provincial or territorial governments. There is also reason to be very concerned about what initiatives may or not be in store for seniors, given that the MBM suggests they currently experience very little poverty.


I wish to thank the following individuals for assistance with this blog post: Miles Corak, Filipe Duarte and his students, Susan Falvo, Reuben Ford, Rob Gillezeau, Seth Klein, Ron Kneebone, Andrew Jackson, Marc Lee, David Macdonald, Michael Mendelson, Allan Moscovitch, Geranda Notten, Charles Plante, Saul Schwartz, Richard Shillington, Vincent St-Martin, John Stapleton, Ricardo Tranjan, and Mike Veall. Any errors are mine.

Ending homelessness in St. John’s: Ten things to know

Ending homelessness in St. John’s: Ten things to know

Ending homelessness in St. John’s: Ten things to know

By Nick Falvo, Doug Pawson, and Jennifer Tipple

Photo by Erik Mclean on Unsplash

End Homelessness St. John’s (EHSJ) is the system-planning organization for the homeless-serving sector in St. John’s, Newfoundland and Labrador. In that capacity, EHSJ plays a central coordinating role and funds important initiatives pertaining to long-term planning.

In 2014, EHSJ unveiled the St. John’s Community Plan to End Homelessness 2014-2019; earlier this year, Nick Falvo Consulting was engaged to both assess that Plan and help EHSJ move forward with their next Plan.

Here are 10 things to know:

1. The 2014-19 Plan helped lay the groundwork for a range of housing and supports. These include: an Intensive Case Management program, launched in January 2016; the Homelessness Prevention and Rapid Rehousing program, focusing on prevention, launched in October 2017; and three Permanent Supportive Housing projects. Nevertheless, community members have articulated the need for more sustainable housing situations. Stakeholders in the sector have been particularly clear about the need for more supportive housing, more low-barrier shelter capacity, and more harm reduction services.

2. Exciting governance changes are happening in the St. John’s homeless-serving sector.  EHSJ historically leaned on community partners for both advisory and governance decisions. Naturally, that led to conflicts of interest that precipitated a new governance direction. Moving forward, EHSJ is transitioning from being under the umbrella of the City of St. John’s into its own non-profit—a transition that will formally take effect in 2019-20. The new EHSJ will be led by a new Executive Director position (hired in March 2019), governed by an independent board of directors, and advised by the community through its new Community Advisory Board.

3. Recent increases in federal funding for homelessness have made a very important difference to St. John’s homeless-serving sector. The federal budgets for 2016 and 2017 respectively led to Canada-wide increases in funding for the Homelessness Partnering Strategy (which has since been renamed Reaching Home). This translated into an additional $1,046,138 for St. John’s homeless-serving sector over a three-period. Put differently, for the five-year period of the St. John’s Plan, St. John’s received 30% more federal homelessness funding than anticipated at the Plan’s outset.

4. The corrections sector in Newfoundland and Labrador creates problems for homelessness. The assessment of the 2014-19 Plan uncovered that inmates in St. John’s are often discharged into homelessness. It is very difficult for a discharged inmate to go directly into housing, in part because landlords want to meet with the tenant before agreeing to sign a rental agreement. It is also very challenging for inmates to see online ads for apartments while in jail. Discharge planning in provincial correctional facilities is part of the role of a Classification Officer, but not every inmate sees a Classification Officer while inside. If an inmate requests to see a Classification Officer, it might take one month to do so. Further, the provincial government requires people to have an address before applying for social assistance, and jail does not count as an address. (Hospitals and the child welfare system also discharge people directly into homelessness, and this is discussed in detail in the forthcoming assessment of the 2014-19 Plan).

5. Once a youth has left Newfoundland and Labrador’s child welfare system, they can be quite vulnerable to homelessness. Housing secured by such youth is often shared; the youth might rent a room in a house with complete strangers. They might struggle in their dealings with housemates and a landlord. St. John’s has some supportive housing available for youth, but these options are in short supply relative to need. Prior to June 2019, youth in the provincial child welfare system could remain in the group home or under the care of a Youth Services case manager until age 18; but they are now allowed to remain in the child welfare system until 21. Local officials who work in the youth homelessness sector have welcomed these changes and believe they have the potential to reduce youth homelessness.

6. The City of St. John’s and EHSJ enjoy a very positive working relationship. The City provides EHSJ with considerable in-kind support, both administratively and operationally. This includes free office space, human resources support, legal support, support with purchasing and procurement, and financial/administrative support. It would not be unreasonable to suggest that the City provides EHSJ with annual in-kind support estimated at $250,000, in addition to an annual cash contribution of $100,000. Going forward, the City has committed to cash contributions in 2019 for $100,000 and in 2020 for $100,000. The City has also supported EHSJ in its new governance structure, supporting EHSJ in seeking the Community Entity status.

7. Service providers in St. John’s are having major challenges with software that tracks persons experiencing homelessness. Canada’s federal government created and now supports the Homeless Individuals and Families Information System (HIFIS) software. Many community agencies in St. John’s are using HIFIS 3.8 (an old version of the software), and it has recently come to light that the federal government has reduced its support for HIFIS 3.8 in order to focus on HIFIS 4. It is estimated that it will be at least another year before HIFIS 4 is available to service providers province-wide.

8. St. John’s needs more low-barrier shelter capacity. Some people are barred from all emergency shelters in St. John’s. Further, it is common for all emergency shelter beds in the city to be full. Several stakeholders also expressed concern about the reliance on for-profit shelters in St. John’s—nearly 40% of homeless shelter beds in the city are run by for-profit providers, paid for by provincial government. And some for-profit emergency housing options have no overnight staffing despite the fact that they often house high-need clients. There is also a rather formal approval process for being admitted into any St. John’s emergency shelter funded by NL Housing. Sometimes it can take up to a week for a client to gain admission.

9. Stakeholders have expressed a strong desire to strengthen Coordinated Access (CA). CA is the triage system used to refer people to housing and homelessness supports. Going forward, most stakeholders want more local organizations to make their housing units and program capacity available for direct referrals. Stakeholders also want to see the CA process become more efficient.

10. The most effective objectives and outcomes in a plan to end homelessness are tangible and measurable. The 2014-19 Plan contained six desired outcomes, some including numerical targets (i.e. provide housing and supports for 460 people) and some not (i.e. develop a coordinated homeless-serving system). The assessment found it difficult to measure progress toward outcomes without specific targets. Local stakeholders would like to see more emphasis on key performance indicators in the next Plan.

In sum. A considerable amount of progress has been made in the fight to end homelessness in St. John’s. But more work remains. That future work will be the focus on the 2019-24 Plan, which will be unveiled later this year.

Download Looking Back to Move Forward: An Assessment of Progress on the 2014-2019 St. John’s Community Plan to End Homelessness

This blog post originally appeared at the website of the Homeless Hub.

The use of homeless shelters by Indigenous peoples in Canada

The use of homeless shelters by Indigenous peoples in Canada

The use of homeless shelters by Indigenous peoples in Canada

The Canadian Press recently gained access to results of analysis of the use of homeless shelters across Canada by Indigenous peoples. The results are summarized in a March 2019 slide presentation obtained by Jordan Press through an Access to Information and Privacy (ATIP) request, and are discussed in this Canadian Press article. They are based on a research project conducted by Employment and Social Development Canada (ESDC).

Here are 10 things to know:


  1. The analysis draws on data gathered from homeless shelters across Canada. ESDC has data on persons using homeless shelters from roughly half of the country’s homeless shelters. This includes data gathered via the Homeless Individuals and Families Information System (HIFIS) software, as well as data gathered via data sharing agreements with the City of Toronto, the Government of Alberta and BC Housing. The data used for this analysis was gathered in 2016 and is based on approximately 133,000 unique individuals (approximately 41,000 of whom are Indigenous).
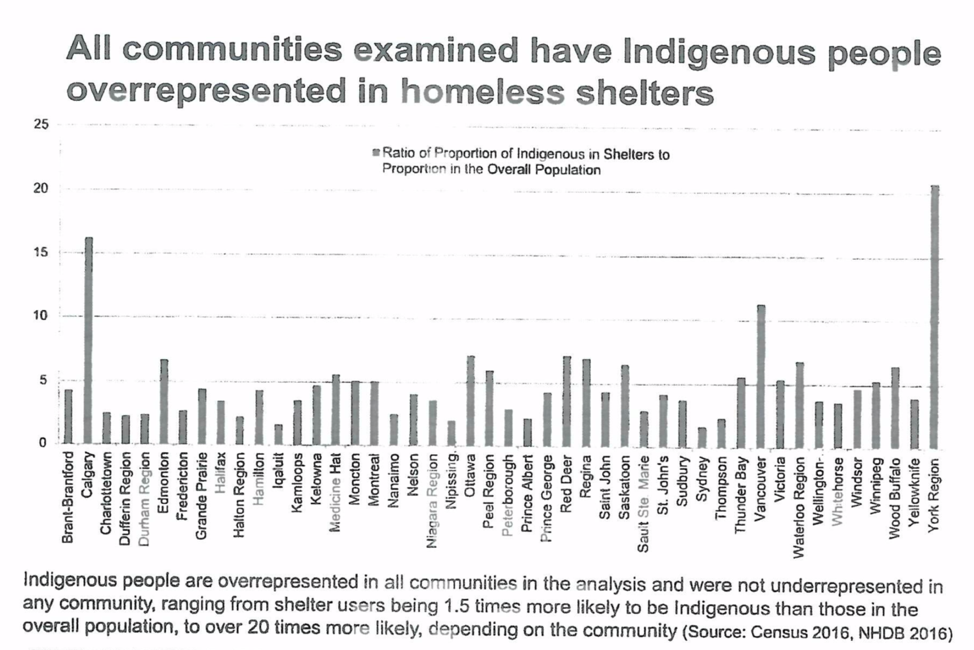
  2. According to the slide presentation, Indigenous peoples in Canada are more than 11 times more likely to use a homeless shelter than non-Indigenous people. Results of the analysis are succinctly summarized in a memo prepared for the Minister which accompanies the slide presentation: “Results show that Indigenous peoples are consistently overrepresented in homeless shelters in all 46 communities examined [Indigenous peoples accounted for more than 30% of people using homeless shelters over the course of 2016, while representing less than 5% of the total population]…The degree of overrepresentation is particularly high for Indigenous women, seniors, and Inuit. Indigenous shelter users experience more shelter stays each year, and are less likely to exit a shelter because of finding a residence.”
  3. As noted in the accompanying memo: “A report is being written to expand on the results shown in the deck.” Neither the memo nor the slide presentation indicate when the report will be ready, which people and groups will be invited to provide input on drafts of the report, or whether the report will be made public. Put differently, the federal government seems to be holding its cards close to its chest on this.
  4. I was personally surprised to see the extent to which Indigenous peoples experience high episodic shelter use.  In other words, Indigenous peoples (compared with non-Indigenous peoples) tend to cycle in and out of shelters with high frequency, rather than stay for long periods of time.[1]
  5. I find it remarkable that these very important research findings had to be obtained via an ATIP request. In light of the federal government’s stated commitment to reconciliation, I would have thought it would have proactively released these findings and engaged Indigenous stakeholders in the process. This raises the following questions: To what extent were Indigenous peoples part of this analysis (beyond the fact that their data was collected and analyzed)? To what extent will Indigenous peoples be invited to discuss the implications of the analysis? Why does the slide presentation make no mention of the Canadian Housing and Renewal Association’s Indigenous Caucus?
  6. The findings pertaining to shorter shelter stays raise at least two questions. First, why do Indigenous peoples have short, but frequent, stays in homeless shelters? Second, what could be done to address this? Frequent migration between urban centres and First Nations communities may help explain this. This may also speak to the need for more low-barrier and culturally-appropriate housing options in Canada—both emergency and permanent options.
  7. The findings showing Inuit over-representation are disturbing, though not surprising. Canada’s Inuit experience high rates of unemployment, poverty, and housing need. For more on this, see: the Inuit Statistical Profile 2018, published by Inuit Tapiriit Kanatami; this Statistics Canada report from 2018; and this profile of Inuit living in Ottawa.
  8. The findings pertaining to women and seniors merit reflection. The analysis finds that, while Indigenous men are more than 10 times more likely to use a homeless shelter over the course of a year than non-Indigenous men, Indigenous women are more than 15 times more likely to use a homeless shelter than non-Indigenous women over the course of a year. Meanwhile, Indigenous seniors are more than 16 times more likely to use a homeless shelter over the course of a year than non-Indigenous seniors. Why would rates of Indigenous over-representation in Canada’s homeless shelters be higher for women and seniors than for other categories?
  9. I was disappointed to see Canada’s largest city dropped from the analysis. According to the slide presentation, City of Toronto data could not be included in the analysis because the City of Toronto lacked Indigenous status data for more than 40% of unique individuals using its homeless shelters. I hope it serves as wake-up call to the Toronto’s homeless-serving sector.
  10. Among the communities studied, Calgary’s rate of Indigenous over-representation was especially high (see screenshot below). The analysis found that, in Calgary, shelter users are about 16 times more likely to be Indigenous than are members of the city’s total population. The rate for Edmonton appears to be about half of that, with only York Region (near Toronto) having a higher rate among the cities studied. It is worth noting that the Calgary Homeless Foundation recently commissioned a research project assessing flow between Treaty 7 First Nations and Calgary’s Homeless-Serving System of Care. Hopefully that project can shed light on this matter. (Full disclosure: I’m one of the research consultants working on this project, along with Gabrielle Lindstrom, Steve Pomeroy, and Jodi Bruhn.)
In sum. Many years of work go into this kind of analysis. Thousands of people were involved in the data collection, including shelter staff and officials both inside and outside of government. Further, people using homeless shelters patiently answered questions about their lives in order for this analysis to happen. However, it is clear that much work remains. It would appear that ESDC up their game in terms of working with Indigenous peoples and groups on such research projects, and some cities clearly must do a better job of data collection. We must all work collectively to understand what specific policy measures are required to address the over-representation of Indigenous peoples in Canada’s homeless shelters.

The following individuals provided me with assistance in preparing this blog post: Jodi Bruhn, Kathy Christiansen, Damian Collins, Dan Dutton, Ron Kneebone, Diana Krecsy, Eric Latimer, Katelyn Lucas, Jenny Morrow, Jennifer Robson, Vincent St-Martin, and two anonymous reviewers. Any errors are mine.

[1] Federal definitions of chronic vs. episodic homelessness are available here.