Social assistance: Do higher benefit levels lead to higher caseloads?

Social assistance: Do higher benefit levels lead to higher caseloads?

Social assistance: Do higher benefit levels lead to higher caseloads?

I’ve recently co-authored a journal article[1] with Ali Jadidzadeh that asks the question: Do higher social assistance benefit levels lead to greater take-up? The short answer is yes, but that doesn’t mean we shouldn’t increase benefit levels.

Here are 11 things to know about the study.

1. The study looks only at employable adult singles without dependants. Other studies asking the same question have looked at other household groups; but ours focuses on single adults without dependants in part because this group receives very little public policy attention, and in part because they comprise most persons experiencing absolute homelessness in Canada.

2. While the study measures the impact of a variety of independent variables on caseloads, the one we were most interested in was benefit levels. Other independent variables considered in the study are: the official unemployment rate; ‘working poor’ income (e.g., third and fourth decile income); population variation over time; and social assistance rule changes.

3. The study uses three alternative models to estimate the impact of these variables. Essentially, different measurement techniques have their strengths and weaknesses, so it’s common for statistical work like this to use a variety of approaches so that the reader can compare findings.

4. The first model finds an important relationship between benefit levels and caseload growth. Specifically, it finds that a 1% increase in the real (i.e., inflation-adjusted) value of benefit levels results in a 0.372% increase in caseloads. This model uses pooled Ordinary Least Squares (OLS), an approach that doesn’t account for provincial fixed effects (i.e., characteristics of provinces that don’t vary over time). These results should therefore be taken less seriously than the other two models.

5. The second model finds a rather modest relationship between increases in benefit levels and caseload growth. Specifically, it finds that a 1% increase in the real value of benefit levels results in just a 0.157% increase in caseloads. This approach uses fixed effects OLS, meaning it accounts for unobservable provincial characteristics.

6. The third model finds the relationship to be a bit stronger. This approach uses Panel Fully Modified OLS and finds a 1% increase in the real value of benefit levels to result in a 0.457% increase in caseloads. This approach is considered good when researchers want to study long-run relationships between continuous (i.e., quantifiable) variables. It’s a relatively new approach that has gained currency in the past five years.

7. There’s an important takeaway from this. Specifically, a 10% increase in the real value of social assistance benefit levels would likely result in caseload growth for this group of between 1.57% and 4.57%. Many observers would consider this to be modest caseload growth.

8. Rule changes are important, but they are difficult to measure. In the mid-1990s, several large provinces introduced strict eligibility criteria (including the introduction of work-for-welfare provisions). The study finds their impact in reducing caseloads to be statistically significant. However, in general, it is very challenging for statistical analysis to measure the impact of rule changes on caseloads.

9. The unemployment rate has a modest impact on caseloads. In the first model, a one percentage point decrease in the unemployment rate is found to be associated with a 7.3% drop in caseloads (in the second model, it’s associated with a 5.8% drop). One implication from this is that provincial and territorial officials should not expect job creation alone to wipe out social assistance caseloads for employable singles.

10. The study cautions policymakers against focusing too much on the sizes of caseloads. In other words, when deciding on the appropriate levels of benefits, the study encourages policymakers to consider positive outcomes associated with higher benefit levels.

11. Higher social assistance benefit levels can help accomplish other policy objectives. As the study points out, they can reduce the percentage of Canadians living in poverty, reduce levels of food insecurity, improve health outcomes and reduce homelessness (all of which can result in savings of their own to the taxpayer). So if higher benefit levels also result in modest caseload growth, that may not be so bad. 

In sum. There are many positive outcomes associated with higher social assistance benefit levels. Having said that, when policymakers decide to increase benefit levels, they should budget for some increased take-up.

I wish to thank the following individuals for assistance with this blog post: Susan Falvo, Ali Jadidzadeh, Richard Shillington and Vincent St-Martin.

[1] For a full copy of the article, please email me at falvo.nicholas@gmail.com.

The use of homeless shelters by Indigenous peoples in Canada

The use of homeless shelters by Indigenous peoples in Canada

The use of homeless shelters by Indigenous peoples in Canada

The Canadian Press recently gained access to results of analysis of the use of homeless shelters across Canada by Indigenous peoples. The results are summarized in a March 2019 slide presentation obtained by Jordan Press through an Access to Information and Privacy (ATIP) request, and are discussed in this Canadian Press article. They are based on a research project conducted by Employment and Social Development Canada (ESDC).

Here are 10 things to know:


  1. The analysis draws on data gathered from homeless shelters across Canada. ESDC has data on persons using homeless shelters from roughly half of the country’s homeless shelters. This includes data gathered via the Homeless Individuals and Families Information System (HIFIS) software, as well as data gathered via data sharing agreements with the City of Toronto, the Government of Alberta and BC Housing. The data used for this analysis was gathered in 2016 and is based on approximately 133,000 unique individuals (approximately 41,000 of whom are Indigenous).
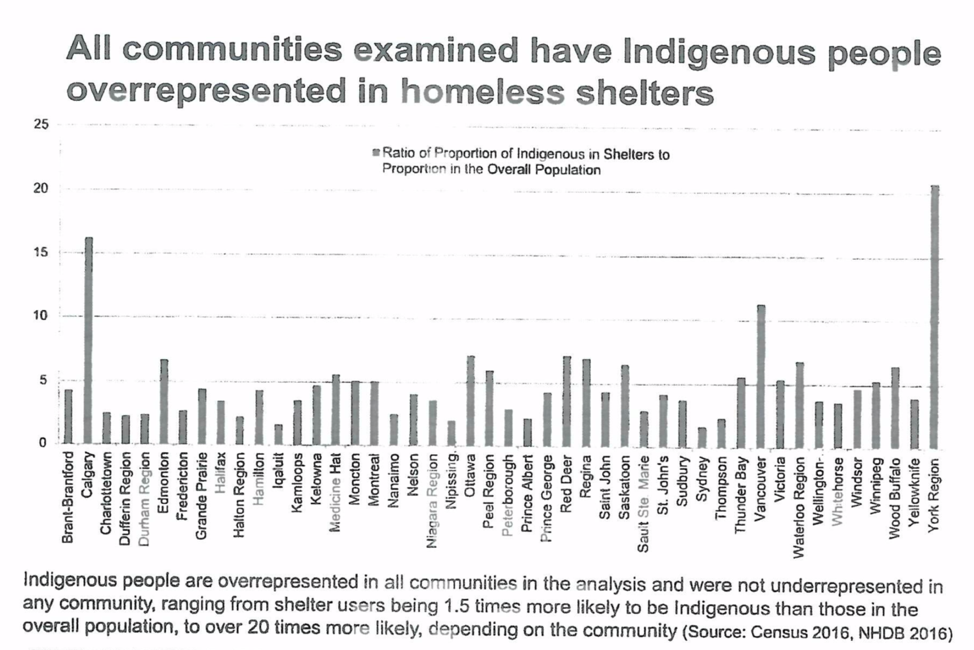
  2. According to the slide presentation, Indigenous peoples in Canada are more than 11 times more likely to use a homeless shelter than non-Indigenous people. Results of the analysis are succinctly summarized in a memo prepared for the Minister which accompanies the slide presentation: “Results show that Indigenous peoples are consistently overrepresented in homeless shelters in all 46 communities examined [Indigenous peoples accounted for more than 30% of people using homeless shelters over the course of 2016, while representing less than 5% of the total population]…The degree of overrepresentation is particularly high for Indigenous women, seniors, and Inuit. Indigenous shelter users experience more shelter stays each year, and are less likely to exit a shelter because of finding a residence.”
  3. As noted in the accompanying memo: “A report is being written to expand on the results shown in the deck.” Neither the memo nor the slide presentation indicate when the report will be ready, which people and groups will be invited to provide input on drafts of the report, or whether the report will be made public. Put differently, the federal government seems to be holding its cards close to its chest on this.
  4. I was personally surprised to see the extent to which Indigenous peoples experience high episodic shelter use.  In other words, Indigenous peoples (compared with non-Indigenous peoples) tend to cycle in and out of shelters with high frequency, rather than stay for long periods of time.[1]
  5. I find it remarkable that these very important research findings had to be obtained via an ATIP request. In light of the federal government’s stated commitment to reconciliation, I would have thought it would have proactively released these findings and engaged Indigenous stakeholders in the process. This raises the following questions: To what extent were Indigenous peoples part of this analysis (beyond the fact that their data was collected and analyzed)? To what extent will Indigenous peoples be invited to discuss the implications of the analysis? Why does the slide presentation make no mention of the Canadian Housing and Renewal Association’s Indigenous Caucus?
  6. The findings pertaining to shorter shelter stays raise at least two questions. First, why do Indigenous peoples have short, but frequent, stays in homeless shelters? Second, what could be done to address this? Frequent migration between urban centres and First Nations communities may help explain this. This may also speak to the need for more low-barrier and culturally-appropriate housing options in Canada—both emergency and permanent options.
  7. The findings showing Inuit over-representation are disturbing, though not surprising. Canada’s Inuit experience high rates of unemployment, poverty, and housing need. For more on this, see: the Inuit Statistical Profile 2018, published by Inuit Tapiriit Kanatami; this Statistics Canada report from 2018; and this profile of Inuit living in Ottawa.
  8. The findings pertaining to women and seniors merit reflection. The analysis finds that, while Indigenous men are more than 10 times more likely to use a homeless shelter over the course of a year than non-Indigenous men, Indigenous women are more than 15 times more likely to use a homeless shelter than non-Indigenous women over the course of a year. Meanwhile, Indigenous seniors are more than 16 times more likely to use a homeless shelter over the course of a year than non-Indigenous seniors. Why would rates of Indigenous over-representation in Canada’s homeless shelters be higher for women and seniors than for other categories?
  9. I was disappointed to see Canada’s largest city dropped from the analysis. According to the slide presentation, City of Toronto data could not be included in the analysis because the City of Toronto lacked Indigenous status data for more than 40% of unique individuals using its homeless shelters. I hope it serves as wake-up call to the Toronto’s homeless-serving sector.
  10. Among the communities studied, Calgary’s rate of Indigenous over-representation was especially high (see screenshot below). The analysis found that, in Calgary, shelter users are about 16 times more likely to be Indigenous than are members of the city’s total population. The rate for Edmonton appears to be about half of that, with only York Region (near Toronto) having a higher rate among the cities studied. It is worth noting that the Calgary Homeless Foundation recently commissioned a research project assessing flow between Treaty 7 First Nations and Calgary’s Homeless-Serving System of Care. Hopefully that project can shed light on this matter. (Full disclosure: I’m one of the research consultants working on this project, along with Gabrielle Lindstrom, Steve Pomeroy, and Jodi Bruhn.)
In sum. Many years of work go into this kind of analysis. Thousands of people were involved in the data collection, including shelter staff and officials both inside and outside of government. Further, people using homeless shelters patiently answered questions about their lives in order for this analysis to happen. However, it is clear that much work remains. It would appear that ESDC up their game in terms of working with Indigenous peoples and groups on such research projects, and some cities clearly must do a better job of data collection. We must all work collectively to understand what specific policy measures are required to address the over-representation of Indigenous peoples in Canada’s homeless shelters.

The following individuals provided me with assistance in preparing this blog post: Jodi Bruhn, Kathy Christiansen, Damian Collins, Dan Dutton, Ron Kneebone, Diana Krecsy, Eric Latimer, Katelyn Lucas, Jenny Morrow, Jennifer Robson, Vincent St-Martin, and two anonymous reviewers. Any errors are mine.

[1] Federal definitions of chronic vs. episodic homelessness are available here.

Book review: Understanding spatial media

Book review: Understanding spatial media

Book review: Understanding spatial media

Rob KitchinTracey Lauriault and Matthew Wilson recently co-edited a book titled Understanding Spatial Media. Published by SAGE, this book is about technology, power, people, democracy and geography.

Here are 10 things to know about the book.

1. The book can help us make better decisions pertaining to the acquisition and use of technology and data. Technological advancements happen quickly; this book encourages the reader to think carefully about these changes. It encourages us to think sociologically and technologically at the same time. That’s because technology isn’t neutral; there are politics and values embedded within it. We shape technology, which in turn shapes us.

2. This book matters because homelessness is inherently geographical. As an example, many households currently experiencing homelessness in Calgary used to live in First Nations communities. Understanding what’s driving their ‘flow in’ to Calgary’s Homeless-Serving System of Care is an important part of understanding homelessness in Calgary. Across Canada, rates of child poverty are much higher ‘on reserve’ than ‘off reserve.’ The visual below, taken from this report, makes that point quite clear.

Child Poverty rates graph

3. The book is relevant to Point-in-Time (PiT) Counts of homelessness. Chapter 21 is about spatial profiling; it looks at the action of classifying people and then acting according to that classification. As noted by Calgary Homeless Foundation’s CEO, Diana Krecsy: “The language we use in PiT Counts gets translated into policy discussions.” For example, if communities choose to start counting veterans experiencing homelessness (as has happened in many Canadian communities over the past several years) it can translate into more attention being focused on the housing needs of veterans (which I would argue has also happened).[1] Indeed, categories and definitions used in PiT Counts are not value neutral.

4. Chapter 4, “Digitally Augmented Geographies,” highlights important differences in Internet accessibility globally. Authored by Mark Graham, I found this chapter very readable. Points raised in the chapter include the fact that approximately one-quarter of the world’s population “has still never used the internet” (p. 46). The chapter further notes that, of the approximately 3 billion people in the world who do use the Internet, “many are forced to use it in very restricted ways because of economic necessity (e.g. metered plans, bandwidth caps), technical limitations (e.g. slow connectivity speeds) and government restrictions (e.g. censorship or surveillance)” (p. 46). This is relevant for persons experiencing homelessness, and it’s especially relevant to northern regions of Canada; it’s also an important advocacy area for the Federation of Canadian Municipalities.[2]

5. Chapter 5, “Locative and Sousveillant Media,” discusses the use of smartphones to capture things on video…including things that weren’t intended to be captured on video. Readers learn that approximately two-thirds of the world’s population keeps a smartphone “within arms reach [sic] at all times, reaching for it 150 times per day…” (p. 57). The same chapter includes a discussion of people whipping out their phones and catching ‘incidents of interest’ on video—for me, this brought to mind a May 2017 incident in which a Toronto security guard was caught on camera while throwing objects at a man experiencing homelessness.

6. Chapter 7, titled “Urban Dashboards,” discusses a topic that is very relevant to my work at the Calgary Homeless Foundation (CHF). It notes that, since roughly 1990, the term “dashboard” has denoted “a screen giving a graphical summary of various types of information, typically used to give an overview of (part of) a business organization” (p. 75). It further notes: “Business and urban data displays often mimic the dashboard instrumentation of cards or aeroplanes. Where in a car you would find indicators for speed, oil and fuel levels, here you will find widgets representing an organization’s ‘key performance indicators’: cash flow, stocks, inventory and so forth” (p. 77). Below, readers can see an excerpt from a Calgary community dashboard.

ExternalDashboard_2017_07_05_CROP


This image is an excerpt from a Calgary community dashboard measuring collective impact on specific goals pertaining to homelessness to reach by the end of 2018.

7. Several of the book’s chapters are relevant to research currently being done at CHF. CHF is currently doing some ‘GIS mapping’ research. For clients receiving CHF-funded housing, we’re looking at the postal codes where they came from (before entering Calgary’s Homeless-Serving System of Care) as well as postal codes of the housing units where they end up (once we help house them). Similar research is discussed at various junctures of the book. The book’s co-editor, Dr. Tracey Lauriault, recently explained: “One of aims of the book in general is to give you the ‘critical thinking chops’ needed to do GIS mapping research.”

8. The book touches on many of the same issues discussed at the Canadian Homelessness Data Sharing Initiative. This annual event, co-hosted by CHF and the University of Calgary’s School of Public Policy, discusses infrastructure (i.e. where to store data); modeling and schemas (i.e. rules related to a classification system); analytics (i.e. the use of techniques, statistics and software), access to data, sensitivity (i.e. respecting people); linked data; and transparency. All of these topics are discussed in the book. (I’ve previously blogged about the inaugural data-sharing event here, and I’ve recently blogged about the second annual event here).

9. The authors who contributed to this book represent a diverse collection of scholars.Scholars from 18 universities, spanning six countries, participated in the effort. This is indicative of some impressive professional networking on the part of the book’s three editors—they opened a tent and let a lot of thinkers come inside it. This serves readers well.

10. This book is geared mostly to other researchers in geography and media studies. Most of the book’s intended readers are university professors and upper-level university students. I personally had great difficulty understanding several of the chapters. I even found Chapter 1 to be very difficult (it uses the words ontogenetic, neogeography, multivocal, geovisual and synoptic). I would therefore not recommend this book to people who lack prior knowledge in the realm of spatial media.

I wish to thank the following individuals for invaluable assistance with this blog post:   Vicki Ballance, Rachel Campbell, Chantal Hansen, Patrick Hunter, Diana Krecsy, Tracey Lauriault, Kara Layher, Michael Lenczner, Lindsay Lenny and  Joel Sinclair.  Any errors are mine.


[1] For examples of recent attention to veterans’ homelessness in Canada, see this this Globe and Mail article and this PowerPoint presentation. (I suspect that a variety of factors, not just PIT Counts, have likely led to increased policy attention on veterans’ homelessness in Canada over the past several years.)

[2] You can download a “pre-publication version” of this chapter here, free of charge. You can check out Professor Graham’s web site here, and you can see his contributions to The Guardian here.


You can view a PDF version of this blog post here: Book review- Understanding spatial media 

Second Annual Canadian Homelessness Data Sharing Initiative

Second Annual Canadian Homelessness Data Sharing Initiative

Second Annual Canadian Homelessness Data Sharing Initiative

On May 18, 2017, the Second Annual Canadian Homelessness Data Sharing Initiative took place in Calgary (all slide presentations, as well as photos from the event, are available here). The event was organized by the Calgary Homeless Foundation and the University of Calgary’s School of Public Policy, and the participants included:  people who build datasets (about persons experiencing homelessness); researchers who use that data; persons with lived experience; and public servants.

Here are 10 things to know about this year’s event:

1. For the second year in a row, there was strong representation from Canada’s federal government. Five officials from Employment and Social Development Canada (ESDC) participated, three of whom had formal speaking roles at the event. Aaron Segaert (from ESDC) presented data from more than 200 homeless shelters between 2005 and 2014, showing that:

  • the occupancy rate (i.e. % of beds filled each night) across these shelters rose from 83% in 2010 to 92% in 2014;
  • the average ‘duration of stay’ by households using these shelters is increasing, especially for families and seniors;
  • the number of seniors using homeless shelters annually nearly doubled across Canada between 2005 and 2014.

2. This year’s event had strong Quebec representation. Research presented by Annie Duchesne, for example, finds that certain subgroups of persons in Montreal’s largest homeless shelter are more likely to experience chronic homelessness (i.e. long-term homelessness) than others—those subgroups include persons over the age of 50, persons with mental health problems and persons with disabilities.

3. Indigenous perspectives were presented. Bonnie Healy’s presentation focused on the work of the Alberta First Nations Information Governance Centre. Topics raised in her presentation included First Nations OCAP principles, a publication titled First Nations – Health Trends Alberta, the First Nations health status report for the Alberta region, the work of the Alberta First Nations Governance Centre, and Indigenous logic models.

4. Several data-sharing advocates actively participated in this year’s event. Michael Lenczner, a data-sharing champion in Canada’s social sector, attended and spoke at this year’s event. He stated that, in terms of data sharing, he’s not aware of any other subsector of Canada’s non-profit sector that has an annual forum to discuss the importance of data. He also cited Alberta as a leader in data sharingmaking reference mostly to PolicyWise, who’ve worked with government to link client administrative data from multiple ministries. They’re the leaders of this kind of data-linking in Canada, and possibly the world.

5. Difficulties with researchers accessing federal homelessness data were raised. Tracey Lauriault is a Carleton University professor who described her past difficulties in trying to access HIFIS data for research. When she did, she was told that her data requests must be sent to community coordinators; yet, federal officials were never able to provide her with a list of community coordinators.

6. One of the event highlights was a panel discussion on moving towards increased national integration of Homelessness Management Information Systems (HMIS). As I’ve written before, there are multiple software systems across Canada that keep data on persons experiencing homelessness; many people would like to see increased integration of these systems (possibly into one very large system, or at least the sharing of data among these systems so that researchers can have larger samples for their work). Henry Dagher (ESDC) discussed the evolution of the Homeless Individuals and Families Information System (HIFIS) software system (which is one type of HMIS system). This federally-administered HIFIS system is now operating in more than 100 communities. HIFIS 4 is now web-based and gaining strong momentum; BC Housing is now implementing HIFIS province-wide (spanning approximately 200 service providers). Several panel members suggest that community members need to gain more control of HIFIS (via a stakeholder advisory body with some clout that includes persons with lived experience). As Michael Lenczner puts it: “The tail shouldn’t wag the dog.” Jenn Legate (Calgary Homeless Foundation) raised several operational concerns that need to be kept in mind as we move forward on increased national integration of HIMIS systems—namely, the ongoing costs a server, the cost of migrating data from an old database system to a new system, challenges pertaining to customer service provided by software vendors, and legal barriers to data sharing.

7. Important findings were presented from Canada’s recent nationally-coordinated Point in Time Count of homeless persons. Patrick Hunter’s presentation noted that more than 25% of homeless persons enumerated during the 2016 count did not use an emergency shelter during the previous year—I think this speaks in part to conditions in emergency shelters, about which there’s virtually no research.[1] Hunter also reported that Indigenous peoples are nine times more likely to experience homelessness than the rest of Canada’s population; what’s more, more likely to experience longer homeless spells than non-Indigenous people.

8. One of the event highlights was a “review of the day” by Stephen Metraux. Metraux, the Director of the Health Policy Program at the University of the Sciences in Philadelphia, gave a ‘wrap up’ presentation that included a short slide presentation. He subsequently wrote a blog post in which he reflected on his experience at the event.

9. Several suggestions were made about a ‘way forward.’ Topics that need to be tackled in the future include:

10. This will continue to be an annual event that we expect to be held each year in (or near) Calgary. It may also evolve into a two-day format, with one day focusing on the operational aspects associated with building, maintaining and improving HMIS systems. All of these operational matters are the focus of this biannual event in the United States; yet, no Canadian equivalent currently exists.

In Sum. We hope this annual event will help communities across Canada get closer to ending homelessness. The event web page—with slide presentations and minutes from the event—can be found here.

A blog post written about the First Annual Canadian Homelessness Data Sharing Initiative can be found here.

The author wishes to thank the following individuals for invaluable assistance with this blog post: Vicki Ballance, Ron Kneebone, Eric Latimer, Tracey Lauriault, Kara Layher, Michael Lenczner, Lindsay Lenny, Stephen Metraux and one anonymous source. Any errors lie with the author.


[1] This 2016 report on conditions inside Out of the Cold facilities and Warming Centres is worth reading. However, it should be noted that the facilities that are the focus of this report are not “homeless shelters” as defined by City of Toronto officials; rather, they operate separately from the formal shelter system.


You can view a PDF version of this blog post here: Second Annual Canadian Homelessness Data Sharing Initiative