Lifting singles out of poverty in Canada

Lifting singles out of poverty in Canada

Lifting singles out of poverty in Canada

I’ve written a report for the Montreal-based Institute for Research on Public Policy making the case for higher social assistance benefit levels for employable single adults without dependants. The link to the report is here.

Here are 10 things to know.

1. In Canada, most employable adult singles without dependants who receive social assistance get less than $10,000/yr. in benefits. This amount of money is ridiculously low (keeping in mind that this figure includes all forms of tax credits received by the recipient). A person with this income must use it to pay for housing, food, transportation and other basic necessities (to see benefit levels in every province and territory, check out Welfare in Canada).

2. In relation to Canada’s official poverty line, social assistance benefit levels for this household group are dismal. ‘Welfare income’—which includes social assistance benefit levels, child benefits and all forms of tax credits—brings couples with two children to between 75% and 95% of the federally-defined poverty line, depending on the province (see figure 1 below). However, welfare income for employable singles without dependants typically comes to about 50% of the poverty line for this particular household type.


3. In most provinces and territories, $10,000 is less than half of what a minimum wage earner would earn in one year working full-time hours. Historically, policy-makers and economists have often been nervous about setting social assistance benefit levels high enough to make paid work unattractive. However, that shouldn’t be a major concern right now in most parts of Canada, as the differential between welfare incomes and minimum wage rates is currently quite substantial.

4. Increases to social assistance benefit levels could help Canada’s federal government achieve its poverty reduction targets. In Canada, we say a household is in ‘deep income poverty’ if it makes less than 75% of the official poverty line. Canada’s Poverty Reduction Strategy, unveiled in October 2018, seeks to track progress on this indicator. Increases in social assistance benefit levels would be a very easy way for progress to be made in this respect.

5. Doing so could also help provincial and territorial governments achieve their poverty reduction targets. All provinces and territories now have their own poverty reduction strategies; many of these strategies include targets pertaining to reducing the number of people under the poverty line (New Brunswick’s strategy actually seeks to reduce deep income poverty by 50%). Increasing social assistance benefit levels would help all provinces and territories achieve their targets.

6. More than half of people in Canada who are in ‘deep income poverty’ are singles. Not only do singles receive very low social assistance benefit levels relative to other household types, but they also do not realize many of the economies of scale that come with cohabitating (e.g., shared rent, shared utility costs, etc.). This reality makes this household group all the more worthy of policy attention.

7. Higher social assistance benefit levels can result in less homelessness. It’s intuitive for many of us that higher social assistance benefit levels would both reduce the likelihood of a person losing their housing and also increase the likelihood of a person experiencing homelessness to obtain rental housing on the private market. Research by Ron Kneebone and Margarita Wilkins confirms this, estimating that a $1,500/yr. increase in social assistance benefits for an employable single without dependants would (in 2011) reduce the use of shelter beds on any given night by nearly 20%.

8. Higher benefit levels can improve food security. A recent study in British Columbia confirms this, finding that overall rates of food security improved among social assistance recipients after a one-time increase in social assistance benefit levels in that province. 

9. Less homelessness and improved food security would almost certainly result in public cost savings. The costs of homelessness to the taxpayer are well documented, as are the healthcare costs associated with food insecurity. Put differently, increasing public expenditure on social assistance would likely result in public savings elsewhere.

10. While higher benefit levels would likely lead to more takeup, this increased takeup would be modest. That is precisely the finding of a recent Canadian study that I co-authored with Ali Jadidzadeh. We found that a 10% increase in the real value of social assistance benefit levels for this same household group would likely result in an increase in caseloads of less than 5%.

In sum. When it comes to social assistance across Canada, employable single adults without dependants are a very neglected subgroup. Increasing their benefit levels would likely result in less poverty, improved food security and less homelessness.


I wish to thank Susan Falvo, Lynn McIntyre, Vincent St-Martin and Val Tarasuk for assistance with this blog post.
Social assistance: Do higher benefit levels lead to higher caseloads?

Social assistance: Do higher benefit levels lead to higher caseloads?

Social assistance: Do higher benefit levels lead to higher caseloads?

I’ve recently co-authored a journal article[1] with Ali Jadidzadeh that asks the question: Do higher social assistance benefit levels lead to greater take-up? The short answer is yes, but that doesn’t mean we shouldn’t increase benefit levels.

Here are 11 things to know about the study.

1. The study looks only at employable adult singles without dependants. Other studies asking the same question have looked at other household groups; but ours focuses on single adults without dependants in part because this group receives very little public policy attention, and in part because they comprise most persons experiencing absolute homelessness in Canada.

2. While the study measures the impact of a variety of independent variables on caseloads, the one we were most interested in was benefit levels. Other independent variables considered in the study are: the official unemployment rate; ‘working poor’ income (e.g., third and fourth decile income); population variation over time; and social assistance rule changes.

3. The study uses three alternative models to estimate the impact of these variables. Essentially, different measurement techniques have their strengths and weaknesses, so it’s common for statistical work like this to use a variety of approaches so that the reader can compare findings.

4. The first model finds an important relationship between benefit levels and caseload growth. Specifically, it finds that a 1% increase in the real (i.e., inflation-adjusted) value of benefit levels results in a 0.372% increase in caseloads. This model uses pooled Ordinary Least Squares (OLS), an approach that doesn’t account for provincial fixed effects (i.e., characteristics of provinces that don’t vary over time). These results should therefore be taken less seriously than the other two models.

5. The second model finds a rather modest relationship between increases in benefit levels and caseload growth. Specifically, it finds that a 1% increase in the real value of benefit levels results in just a 0.157% increase in caseloads. This approach uses fixed effects OLS, meaning it accounts for unobservable provincial characteristics.

6. The third model finds the relationship to be a bit stronger. This approach uses Panel Fully Modified OLS and finds a 1% increase in the real value of benefit levels to result in a 0.457% increase in caseloads. This approach is considered good when researchers want to study long-run relationships between continuous (i.e., quantifiable) variables. It’s a relatively new approach that has gained currency in the past five years.

7. There’s an important takeaway from this. Specifically, a 10% increase in the real value of social assistance benefit levels would likely result in caseload growth for this group of between 1.57% and 4.57%. Many observers would consider this to be modest caseload growth.

8. Rule changes are important, but they are difficult to measure. In the mid-1990s, several large provinces introduced strict eligibility criteria (including the introduction of work-for-welfare provisions). The study finds their impact in reducing caseloads to be statistically significant. However, in general, it is very challenging for statistical analysis to measure the impact of rule changes on caseloads.

9. The unemployment rate has a modest impact on caseloads. In the first model, a one percentage point decrease in the unemployment rate is found to be associated with a 7.3% drop in caseloads (in the second model, it’s associated with a 5.8% drop). One implication from this is that provincial and territorial officials should not expect job creation alone to wipe out social assistance caseloads for employable singles.

10. The study cautions policymakers against focusing too much on the sizes of caseloads. In other words, when deciding on the appropriate levels of benefits, the study encourages policymakers to consider positive outcomes associated with higher benefit levels.

11. Higher social assistance benefit levels can help accomplish other policy objectives. As the study points out, they can reduce the percentage of Canadians living in poverty, reduce levels of food insecurity, improve health outcomes and reduce homelessness (all of which can result in savings of their own to the taxpayer). So if higher benefit levels also result in modest caseload growth, that may not be so bad. 

In sum. There are many positive outcomes associated with higher social assistance benefit levels. Having said that, when policymakers decide to increase benefit levels, they should budget for some increased take-up.

I wish to thank the following individuals for assistance with this blog post: Susan Falvo, Ali Jadidzadeh, Richard Shillington and Vincent St-Martin.

[1] For a full copy of the article, please email me at falvo.nicholas@gmail.com.

Social assistance: Do higher benefit levels lead to higher caseloads?

Ten things to know about poverty measurement in Canada

Ten things to know about poverty measurement in Canada

On October 29, I gave a guest presentation to Professor Filipe Duarte’s master’s seminar class at the University of Windsor. The topic of my presentation was poverty measurement in Canada.

Here are 10 things to know.

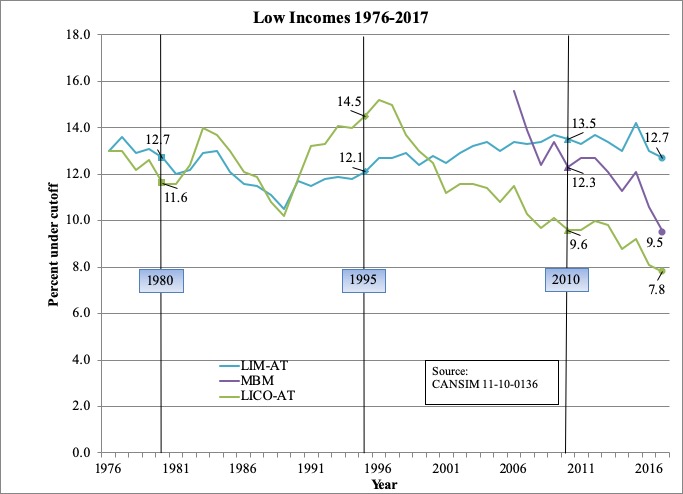
  1. Use of the Low-Income Cut-Off (LICO) would suggest that poverty in Canada has decreased dramatically since the mid-1990s. LICO focuses on the amount of money spent by a family on ‘necessities’ (i.e., housing, food and clothing) as determined by a group of federal public servants. If a family is spending a substantially higher percentage of their income on such necessities—e.g., 20 percentage points higher than the average Canadian family—then the family in question falls below the LICO. The LICO was supposed to be recalculated on a regular basis to reflect changes in spending patterns, but that hasn’t happened since 1992 and is one likely reason for the reduction in poverty shown by this measure (having said that, the LICO has been adjusted each year for inflation). Today, very few experts take the LICO seriously.
  2. Use of the Low Income Measure (LIM) would suggest that poverty in Canada has seen mild fluctuations since the mid-1990s. LIM’s focus is on the family’s income, not on what they spend. A family whose income is below 50% of the national median income (adjusted for family size) is said to be poor according to this measure. LIM, in effect, measures income inequality among the bottom half of income earners. The LIM is useful for international comparisons (though it is far from perfect in that regard, as it looks only at income, not the availability of social programs). 
  3. Use of the Market Basket Measure (MBM) suggests that Canada has seen a major decrease in poverty over the past decade. With the MBM, public officials figure out the cost of a basket of goods and services they feel is sufficient for a standard of living “between the poles of subsistence and social inclusion.” Calculations are then made about how much such a basket costs (the cost of this basket has been estimated for 50 regions across Canada). The content of this basket is periodically adjusted, the last time being in 2011, and its value gets adjusted each year for inflation. If you’re poor according to the MBM, it’s because experts believe you could not afford that basket of goods in your community.

    Visual courtesy of Kevin Milligan.

  4. One of the LICO’s shortcomings is that it doesn’t do a good job of accounting for regional variations in the cost of living across Canada. The LICO (as mentioned above) also hasn’t been adjusted since 1992, meaning that it doesn’t currently account for how much things cost today or what people spend money on today (as Andrew Jackson notes, it doesn’t include the cost of Internet). Finally, LICO doesn’t easily allow for international comparisons. 
  5. One of the LIM’s shortcomings is that it can suggest that recessions are good for poverty reduction. As Alain Noël notes, the LIM is “sensitive to changes in the median income, which sometimes produces counterintuitive results. In a recession, for example, when the median income is flat, the poverty rate may seem to be decreasing while unemployment and economic hardship are increasing.” What’s more, the fact that LIM is based on national median income—as opposed to the median income for the province or territory in question—seems arbitrary to many. Indeed, Professor Noël further notes that “real median incomes vary considerably from one province to another.”
  6. Of the three major indicators, my own preference is the LIM. First, it avoids the inherent challenge of deciding what constitutes an appropriate a basket of goods and services in a country of 37 million people, spanning 10 million km2 and six time zones. Second, I think relativity is what’s really important here—if median income across Canada is increasing, then so too should everyone’s (and vice versa). Third, the LIM lends itself well to international comparisons. I’d like to see it calculated based on national median income for international comparisons, and also based on median income for the economic region in question, in order to provide a more meaningful number.
  7. The debate within Canada has largely ignored the need for indicators of assets. This point has been made by David Rothwell and Jennifer Robson, who note that income and assets are not always correlated. For example, a low-wage worker might have an income that brings them above the LIM, but they may also have $75,000 in student loans and credit card debt. Conversely, a senior could be relying exclusively on Old Age Security as a source of income while also owning a $2 million home outright. (Monitoring asset poverty might put pressure on provincial and territorial officials to stop discouraging asset accumulation among social assistance recipients.)
  8. It’s also important to directly measure material deprivation. For example, core housing need measures the affordability, suitability and adequacy of a person’s housing. Likewise, food insecurity measurement directly assesses the inadequacy or insecurity in access to food due to financial challenges. It’s also important to assess who has access to high-quality childcare and prescription medication. (For a critical analysis of the need to directly measure material deprivation, see this 2017 conference paper.)
  9. In August 2018, Canada’s federal government announced its formal adoption of the MBM as its official poverty measure. Its poverty reduction strategy also unveiled a dashboard of poverty-related indicators. This seems very much in line with a position taken by Peter Hicks in a recent blog post, in which he calls for “an evolving ‘dashboard’ of carefully selected indicators would be more useful than a single measure.” The new federal strategy will use the MBM to monitor progress—importantly, it will not use the MBM to determine program eligibility.
  10. Seniors make for an interesting case study here. According to the LIM, a great many seniors in Canada currently experience poverty. But according to the MBM, very few seniors in Canada currently experience poverty. As Andrew Jackson pointed out last year: “There is a huge difference between the LIM and MBM poverty rates for seniors (14.3% vs 5.1% in 2015.)” And this raises an important question: if Canada’s official poverty measure suggests there’s very little seniors’ poverty, to what extent will Canada’s federal government prioritize assistance for seniors?

In sum. The Trudeau government deserves praise for unveiling a dashboard of poverty indicators that will hopefully receive close attention from federal officials in partnership with provincial, territorial and municipal officials, as well as researchers and advocates. Having said that, Ron Kneebone reminds me that the MBM has yet to be formally adopted by provincial or territorial governments. There is also reason to be very concerned about what initiatives may or not be in store for seniors, given that the MBM suggests they currently experience very little poverty.


I wish to thank the following individuals for assistance with this blog post: Miles Corak, Filipe Duarte and his students, Susan Falvo, Reuben Ford, Rob Gillezeau, Seth Klein, Ron Kneebone, Andrew Jackson, Marc Lee, David Macdonald, Michael Mendelson, Allan Moscovitch, Geranda Notten, Charles Plante, Saul Schwartz, Richard Shillington, Vincent St-Martin, John Stapleton, Ricardo Tranjan, and Mike Veall. Any errors are mine.

Ten things to know about affordable housing in Alberta

Ten things to know about affordable housing in Alberta

Ten things to know about affordable housing in Alberta

People without affordable housing suffer from poor health outcomes, have difficulty finding and sustaining employment and are at greater risk of having their children removed by child welfare authorities.

Here are 10 things to know about affordable housing in Alberta specifically:

  1. The NDP government of Rachel Notley undertook important initiatives pertaining to affordable housing. In its 2016 budget, the Notley government announced the near doubling of provincial spending on housing. This represented a total of $892 million in new funding, spanning a five-year period.
  2. According to the most recent Census, 11.4% of Alberta households experience core housing need, representing more than 164,000 households. In order to assess housing need for Canadians, the Canada Mortgage and Housing Corporation uses a measure called core housing need. A household is said to be in core housing need if, out of financial necessity, they either pay more than 30% of their gross household income on housing, live in housing requiring major repairs, or live in housing with insufficient bedrooms for the household size in question (as determined by the National Occupancy Standards).
  3. Seniors living alone in Alberta face particularly high rates of core housing need. Nearly 34% of senior (65+) females living alone in Alberta were in core housing need in 2011, while the figure for senior (65+) males living alone was just under 26%. 
  4. Female lone-parent households in Alberta also face a particularly high rate of core housing need. More than 27% of these households were in core housing need in 2011. However, that figure likely dropped after the NDP government of Rachel Notley introduced the Alberta Child Benefit, a major feature of the 2016 Alberta budget.
  5. Members of Alberta First Nations also experience very high rates of core housing need. In fact, the rate of core housing need for Status Indians is nearly 25%—more than double the rate for non-Indigenous households in the province. And get this: these core need figures do not account for households living on reserve (if they did, that figure would be much greater). I should also note that more than 25% of  persons experiencing absolute homelessness in Alberta identify as being Indigenous, even though Indigenous peoples make up just 7% of Alberta’s total population.
  6. Housing typically constitutes a larger share of spending for low-income households (compared with middle- and higher-income households). And as the figure below illustrates, that phenomenon got measurably worse for low-income households in Alberta between 2010 and 2016.

    Source. Kneebone, R., & Wilkins, M. G. (2018). Social Policy Trends: Paying for the Essentials: Shelter, Food and Energy Consumption by Household Income Quintile for 2010 and 2016. The School of Public Policy Publications, 11. Retrieved from Policy School’s website: https://www.policyschool.ca/wp-content/uploads/2018/07/Social-Trends-Engel-Curves-July-2018.pdf

  7. On a per capita basis, Alberta has far fewer subsidized housing units than the rest of Canada. According to the most recent Census, subsidized housing represents just 2.9% of Alberta’s housing units; for Canada as a whole, the figure is 4.2%.
  8. Some Alberta cities have much more low-cost rental housing (per capita) than others. The visual below shows the range of private market rents paid on one- and two-bedroom apartments across Alberta’s seven major cities. The light-coloured bars show the range of rents paid on the second quintile (i.e., the second-poorest quintile) of private market rents. The next darkest bar shows the range of rents paid on the third quintile (i.e., the middle quintile) of rents, while the darkest bars define the range of rents paid on the fourth quintile of rents. Among the seven major cities, Medicine Hat appears to have the most low-cost rental housing units (per capita), and Calgary the fewest.

    Notes. Monthly rent quintiles by city in 2017. Data provided to Ron Kneebone (University of Calgary) by Canada Mortgage and Housing Corporation. The range of rents paid on the first and fifth quintiles are not reported due to confidentiality reasons.

  9. Going forward, the impact of the federal government’s National Housing Strategy will be modest. Recent analysis by Canada’s Parliamentary Budget Officer (PBO) projects future federal housing spending to actually decrease over the next decade (relative to Gross Domestic Product). The same analysis projects that total spending on Indigenous housing by Canada’s federal government will be “substantially lower” going forward. (For a general overview of the National Housing Strategy, see this analysis.)
  10. There are considerable cost savings to be realized when investing in affordable housing, especially when the tenants have serious mental health challenges. Subsidized housing for vulnerable subpopulations (including persons with mental health challenges) that is accompanied by professional staff support is referred to as supportive housing. Recent analysis in Calgary estimates considerable cost savings in the health and justice sectors attributable to formerly-homeless persons receiving supportive housing.

In Sum. For a more comprehensive look at affordable housing in Alberta, see this year’s Alberta Alternative Budget (AAB). Full disclosure: I was primary author of the chapter on affordable housing and homelessness.

I wish to thank the following individuals for invaluable assistance with the housing chapter of this year’s AAB: Meaghan Bell, John Kmech, Claire Noble, Chidom Otogwu, Steve Pomeroy, Ron Kneebone, Vincent St. Martin, John Veenstra and one anonymous reviewer. Any errors are mine.

Ten Things to Know About Federal Income Support for Low-Income Seniors in Canada

Ten Things to Know About Federal Income Support for Low-Income Seniors in Canada

Ten Things to Know About Federal Income Support for Low-Income Seniors in Canada

Prepared by Allan Moscovitch, Professor, Carleton University; Nick Falvo, Director of Research & Data at the Calgary Housing Foundation; and David Macdonald, Senior Economist at the Canadian Centre for Policy Alternatives

In the latest edition of How Ottawa Spends, we have a chapter titled “The Federal Government and Old Age Security:  Then, Now, and the Future.” The focus of our chapter was the potential impact of the Harper government’s decision to move the age of eligibility for Old Age Security (OAS) benefits from 65 to 67.

This change had been announced by the Harper government in the 2012 federal budget; it was to start to take effect in 2023. The Trudeau Liberals promised in their recent election platform to notgo ahead with the change; and after the election they did announce they would return the age of qualification for the OAS back to 65.

recent report by Canada’s Parliamentary Budget Office has resulted in some debate as to the wisdom of the Trudeau government changing the age of eligibility for OAS from 67 back to 65.

With all of this in mind, here are 10 things to know about federal income support for seniors in Canada:

  1. The first income-support program for low-income seniors in Canada was called the Old Age Pension. This program took effect in 1927, when the Old Age Pensions Act was passed. Labour unrest after World War I had helped bring this about; there were general strikes all over Canada (including the Winnipeg General Strike in 1919 and a bitter strike in Cape Breton in 1925).  Initially, the federal government would cost-share (50:50) this means-tested pension plan with those provincial governments which chose to participate.   A few years later, this changed to a 75:25 fed-prov split to induce more provinces to join.  From the outset, the program was administered by provincial governments.
  2. Over time, income support for seniors became more generous. When the 1927 legislation was passed, an individual had to be 70 years of age or older in order to qualify. The individual also had to have an assessed annual income of less than $5,120 (in 2015 dollars) at the time of receipt.   The maximum pension a single person could receive was $3,370/yr (in 2015 dollars).  Beginning in 1947, the maximum annual pension that a single person could receive, in 2015 dollars, was $9,200.
  3. Initially, Indians[1] who had status under the Indian Act were explicitly excluded from receiving a pension under the 1927 legislation. The attitude of the federal government at the time was the Indigenous peoples should leave the reserve and stop being Aboriginal. If they left the reserve, they could qualify for an Old Age Pension.  To do that, they had to renounce their Aboriginal status and become a British subject (Canadian citizenship didn’t exist until 1947).
  4. In 1951, major changes were made to this program and it became known as Old Age Security (OAS). In 1951, the Old Age Security Act and the Old Age Assistance Act were both passed, providing the legislative basis for a new pension program that came into being in 1952. The former provided for a pension at age 70 while the latter provided for a pension for people 65 to 69 and in need.  In 1952, the provinces agreed to a constitutional amendment that permitted the federal government to administer the program.  This entire program was financed 100% federally; there would now be no provincial money involved.
  5. With the 1951 changes, members of First Nations were now eligible for benefits. This reflected changes in attitudes after World War II; the public began to realize that returning Indigenous war veterans were not eligible for social welfare benefits that were available to the rest of Canada’s population.
  6. In the mid-1960s, major changes were made to the OAS. Beginning in 1965, the OAS would now be one program for people over the age of 65. By this time, the system included a supplement, cost shared 50:50 with the provinces, that would be available to some seniors between the ages of 65 and 69.  In 1966, the OAS was made available (universally) to anyone 65 and older.  This had the effect of setting a standard for the age of retirement in Canada.
  7. Today’s OAS system serves 5.5 million Canadians; its current annual cost is $35 billion, or about 13% of total spending by Canada’s federal government. As of May 2015, the full OAS was $6,800/yr. That full amount is available to Canadians with annual incomes below $71,592.  Today, low-income seniors who received the OAS can also apply for the Guaranteed Income Supplement (GIS).  The maximum GIS benefit for a single adult is $766/month, or $9,200/year.  In the case of GIS recipients who continue to work, the GIS is ‘clawed back’ at the rate of 50 cents for every dollar of income.   About 1.8 million Canadians receive the GIS today.  This costs Canada’s federal government  almost $11 billion/yr.
  8. With the OAS/GIS system in place, there is substantially less poverty among seniors than there would be if the system were not in place. Using the after-tax Low Income Measure (LIM), an individual or household is ‘in poverty’ if their income is less than 50% of the median income. In 1976, almost 23% of seniors households fell below the LIM; by 1996, this number had declined to a mere 3%.  OAS and GIS are almost certainly responsible for much of this decline.The Canada Pension Plan (CPP)/Quebec Pension Plan (QPP) is also having the effect of lowering the poverty rate for seniors. Once Canadians reach the age of 65 and receive income from OAS, GIS and/or CPP their poverty rate (as measured by the LIM) drops very substantially.  For example, 37% of single females aged 64 in Canada live in poverty; among 65 year-old single females, the rate is just 21%.
  9. Since 2003, the percentage of elderly Canadians in poverty, as measured by the LIM, has risen back up to almost 10%. That’s largely because the LIM is set at 50% of median income adjusted for family size; and since 2003, the median incomes of Canadians have increased in real terms. Meanwhile, lower income seniors rely mostly on OAS/GIS and the CPP/QPP.  OAS/GIS is indexed to the Consumer Prince Index (CPI) only (i.e. not to wages and not median income).  The CPP/QPP you get in the year you retire is tied to average wages; but after you retire, your CPP/QPP increases by CPI only…so you fall relative to median incomes of the general population.
  10. Our chapter argues that, if the change in OAS eligibility were to happen, the percentage of Canadians aged 65 and 66 living in poverty would increase substantially. We made these calculations with the help of Statistics Canada’s Social Policy Simulation Database and Model (note: David Macdonald is a whiz at this!).  Many of those aged 65 and 66 not getting OAS/GIS would likely continue receiving social assistancebenefits; and social assistance benefits are not as generous as the combination of OAS/GIS benefits.  For example, a single senior with no other income currently has access to just over $17,000 annually from OAS and GIS; but as a social assistance recipient, the same person would receive between $7,000 and $11,000 per year (depending on the province)—or $6,000 and $16,000 in the territories.  What’s more, social assistance is funded by provincial governments, meaning that the proposed changed would offload spending from the federal government onto provincial governments.

Frances Abele and Richard Shillington have been very helpful in the preparation of this blog post.  Any errors are our own.

[1] The term “First Nation” was not used until relatively recently.