Lifting singles out of poverty in Canada

Lifting singles out of poverty in Canada

Lifting singles out of poverty in Canada

I’ve written a report for the Montreal-based Institute for Research on Public Policy making the case for higher social assistance benefit levels for employable single adults without dependants. The link to the report is here.

Here are 10 things to know.

1. In Canada, most employable adult singles without dependants who receive social assistance get less than $10,000/yr. in benefits. This amount of money is ridiculously low (keeping in mind that this figure includes all forms of tax credits received by the recipient). A person with this income must use it to pay for housing, food, transportation and other basic necessities (to see benefit levels in every province and territory, check out Welfare in Canada).

2. In relation to Canada’s official poverty line, social assistance benefit levels for this household group are dismal. ‘Welfare income’—which includes social assistance benefit levels, child benefits and all forms of tax credits—brings couples with two children to between 75% and 95% of the federally-defined poverty line, depending on the province (see figure 1 below). However, welfare income for employable singles without dependants typically comes to about 50% of the poverty line for this particular household type.


3. In most provinces and territories, $10,000 is less than half of what a minimum wage earner would earn in one year working full-time hours. Historically, policy-makers and economists have often been nervous about setting social assistance benefit levels high enough to make paid work unattractive. However, that shouldn’t be a major concern right now in most parts of Canada, as the differential between welfare incomes and minimum wage rates is currently quite substantial.

4. Increases to social assistance benefit levels could help Canada’s federal government achieve its poverty reduction targets. In Canada, we say a household is in ‘deep income poverty’ if it makes less than 75% of the official poverty line. Canada’s Poverty Reduction Strategy, unveiled in October 2018, seeks to track progress on this indicator. Increases in social assistance benefit levels would be a very easy way for progress to be made in this respect.

5. Doing so could also help provincial and territorial governments achieve their poverty reduction targets. All provinces and territories now have their own poverty reduction strategies; many of these strategies include targets pertaining to reducing the number of people under the poverty line (New Brunswick’s strategy actually seeks to reduce deep income poverty by 50%). Increasing social assistance benefit levels would help all provinces and territories achieve their targets.

6. More than half of people in Canada who are in ‘deep income poverty’ are singles. Not only do singles receive very low social assistance benefit levels relative to other household types, but they also do not realize many of the economies of scale that come with cohabitating (e.g., shared rent, shared utility costs, etc.). This reality makes this household group all the more worthy of policy attention.

7. Higher social assistance benefit levels can result in less homelessness. It’s intuitive for many of us that higher social assistance benefit levels would both reduce the likelihood of a person losing their housing and also increase the likelihood of a person experiencing homelessness to obtain rental housing on the private market. Research by Ron Kneebone and Margarita Wilkins confirms this, estimating that a $1,500/yr. increase in social assistance benefits for an employable single without dependants would (in 2011) reduce the use of shelter beds on any given night by nearly 20%.

8. Higher benefit levels can improve food security. A recent study in British Columbia confirms this, finding that overall rates of food security improved among social assistance recipients after a one-time increase in social assistance benefit levels in that province. 

9. Less homelessness and improved food security would almost certainly result in public cost savings. The costs of homelessness to the taxpayer are well documented, as are the healthcare costs associated with food insecurity. Put differently, increasing public expenditure on social assistance would likely result in public savings elsewhere.

10. While higher benefit levels would likely lead to more takeup, this increased takeup would be modest. That is precisely the finding of a recent Canadian study that I co-authored with Ali Jadidzadeh. We found that a 10% increase in the real value of social assistance benefit levels for this same household group would likely result in an increase in caseloads of less than 5%.

In sum. When it comes to social assistance across Canada, employable single adults without dependants are a very neglected subgroup. Increasing their benefit levels would likely result in less poverty, improved food security and less homelessness.


I wish to thank Susan Falvo, Lynn McIntyre, Vincent St-Martin and Val Tarasuk for assistance with this blog post.

Social assistance: Do higher benefit levels lead to higher caseloads?

Social assistance: Do higher benefit levels lead to higher caseloads?

Social assistance: Do higher benefit levels lead to higher caseloads?

I’ve recently co-authored a journal article[1] with Ali Jadidzadeh that asks the question: Do higher social assistance benefit levels lead to greater take-up? The short answer is yes, but that doesn’t mean we shouldn’t increase benefit levels.

Here are 11 things to know about the study.

1. The study looks only at employable adult singles without dependants. Other studies asking the same question have looked at other household groups; but ours focuses on single adults without dependants in part because this group receives very little public policy attention, and in part because they comprise most persons experiencing absolute homelessness in Canada.

2. While the study measures the impact of a variety of independent variables on caseloads, the one we were most interested in was benefit levels. Other independent variables considered in the study are: the official unemployment rate; ‘working poor’ income (e.g., third and fourth decile income); population variation over time; and social assistance rule changes.

3. The study uses three alternative models to estimate the impact of these variables. Essentially, different measurement techniques have their strengths and weaknesses, so it’s common for statistical work like this to use a variety of approaches so that the reader can compare findings.

4. The first model finds an important relationship between benefit levels and caseload growth. Specifically, it finds that a 1% increase in the real (i.e., inflation-adjusted) value of benefit levels results in a 0.372% increase in caseloads. This model uses pooled Ordinary Least Squares (OLS), an approach that doesn’t account for provincial fixed effects (i.e., characteristics of provinces that don’t vary over time). These results should therefore be taken less seriously than the other two models.

5. The second model finds a rather modest relationship between increases in benefit levels and caseload growth. Specifically, it finds that a 1% increase in the real value of benefit levels results in just a 0.157% increase in caseloads. This approach uses fixed effects OLS, meaning it accounts for unobservable provincial characteristics.

6. The third model finds the relationship to be a bit stronger. This approach uses Panel Fully Modified OLS and finds a 1% increase in the real value of benefit levels to result in a 0.457% increase in caseloads. This approach is considered good when researchers want to study long-run relationships between continuous (i.e., quantifiable) variables. It’s a relatively new approach that has gained currency in the past five years.

7. There’s an important takeaway from this. Specifically, a 10% increase in the real value of social assistance benefit levels would likely result in caseload growth for this group of between 1.57% and 4.57%. Many observers would consider this to be modest caseload growth.

8. Rule changes are important, but they are difficult to measure. In the mid-1990s, several large provinces introduced strict eligibility criteria (including the introduction of work-for-welfare provisions). The study finds their impact in reducing caseloads to be statistically significant. However, in general, it is very challenging for statistical analysis to measure the impact of rule changes on caseloads.

9. The unemployment rate has a modest impact on caseloads. In the first model, a one percentage point decrease in the unemployment rate is found to be associated with a 7.3% drop in caseloads (in the second model, it’s associated with a 5.8% drop). One implication from this is that provincial and territorial officials should not expect job creation alone to wipe out social assistance caseloads for employable singles.

10. The study cautions policymakers against focusing too much on the sizes of caseloads. In other words, when deciding on the appropriate levels of benefits, the study encourages policymakers to consider positive outcomes associated with higher benefit levels.

11. Higher social assistance benefit levels can help accomplish other policy objectives. As the study points out, they can reduce the percentage of Canadians living in poverty, reduce levels of food insecurity, improve health outcomes and reduce homelessness (all of which can result in savings of their own to the taxpayer). So if higher benefit levels also result in modest caseload growth, that may not be so bad. 

In sum. There are many positive outcomes associated with higher social assistance benefit levels. Having said that, when policymakers decide to increase benefit levels, they should budget for some increased take-up.

I wish to thank the following individuals for assistance with this blog post: Susan Falvo, Ali Jadidzadeh, Richard Shillington and Vincent St-Martin.

[1] For a full copy of the article, please email me at falvo.nicholas@gmail.com.

Social assistance: Do higher benefit levels lead to higher caseloads?

Ten things to know about poverty measurement in Canada

Ten things to know about poverty measurement in Canada

On October 29, I gave a guest presentation to Professor Filipe Duarte’s master’s seminar class at the University of Windsor. The topic of my presentation was poverty measurement in Canada.

Here are 10 things to know.

  1. Use of the Low-Income Cut-Off (LICO) would suggest that poverty in Canada has decreased dramatically since the mid-1990s. LICO focuses on the amount of money spent by a family on ‘necessities’ (i.e., housing, food and clothing) as determined by a group of federal public servants. If a family is spending a substantially higher percentage of their income on such necessities—e.g., 20 percentage points higher than the average Canadian family—then the family in question falls below the LICO. The LICO was supposed to be recalculated on a regular basis to reflect changes in spending patterns, but that hasn’t happened since 1992 and is one likely reason for the reduction in poverty shown by this measure (having said that, the LICO has been adjusted each year for inflation). Today, very few experts take the LICO seriously.
  2. Use of the Low Income Measure (LIM) would suggest that poverty in Canada has seen mild fluctuations since the mid-1990s. LIM’s focus is on the family’s income, not on what they spend. A family whose income is below 50% of the national median income (adjusted for family size) is said to be poor according to this measure. LIM, in effect, measures income inequality among the bottom half of income earners. The LIM is useful for international comparisons (though it is far from perfect in that regard, as it looks only at income, not the availability of social programs). 
  3. Use of the Market Basket Measure (MBM) suggests that Canada has seen a major decrease in poverty over the past decade. With the MBM, public officials figure out the cost of a basket of goods and services they feel is sufficient for a standard of living “between the poles of subsistence and social inclusion.” Calculations are then made about how much such a basket costs (the cost of this basket has been estimated for 50 regions across Canada). The content of this basket is periodically adjusted, the last time being in 2011, and its value gets adjusted each year for inflation. If you’re poor according to the MBM, it’s because experts believe you could not afford that basket of goods in your community.

    Visual courtesy of Kevin Milligan.

  4. One of the LICO’s shortcomings is that it doesn’t do a good job of accounting for regional variations in the cost of living across Canada. The LICO (as mentioned above) also hasn’t been adjusted since 1992, meaning that it doesn’t currently account for how much things cost today or what people spend money on today (as Andrew Jackson notes, it doesn’t include the cost of Internet). Finally, LICO doesn’t easily allow for international comparisons. 
  5. One of the LIM’s shortcomings is that it can suggest that recessions are good for poverty reduction. As Alain Noël notes, the LIM is “sensitive to changes in the median income, which sometimes produces counterintuitive results. In a recession, for example, when the median income is flat, the poverty rate may seem to be decreasing while unemployment and economic hardship are increasing.” What’s more, the fact that LIM is based on national median income—as opposed to the median income for the province or territory in question—seems arbitrary to many. Indeed, Professor Noël further notes that “real median incomes vary considerably from one province to another.”
  6. Of the three major indicators, my own preference is the LIM. First, it avoids the inherent challenge of deciding what constitutes an appropriate a basket of goods and services in a country of 37 million people, spanning 10 million km2 and six time zones. Second, I think relativity is what’s really important here—if median income across Canada is increasing, then so too should everyone’s (and vice versa). Third, the LIM lends itself well to international comparisons. I’d like to see it calculated based on national median income for international comparisons, and also based on median income for the economic region in question, in order to provide a more meaningful number.
  7. The debate within Canada has largely ignored the need for indicators of assets. This point has been made by David Rothwell and Jennifer Robson, who note that income and assets are not always correlated. For example, a low-wage worker might have an income that brings them above the LIM, but they may also have $75,000 in student loans and credit card debt. Conversely, a senior could be relying exclusively on Old Age Security as a source of income while also owning a $2 million home outright. (Monitoring asset poverty might put pressure on provincial and territorial officials to stop discouraging asset accumulation among social assistance recipients.)
  8. It’s also important to directly measure material deprivation. For example, core housing need measures the affordability, suitability and adequacy of a person’s housing. Likewise, food insecurity measurement directly assesses the inadequacy or insecurity in access to food due to financial challenges. It’s also important to assess who has access to high-quality childcare and prescription medication. (For a critical analysis of the need to directly measure material deprivation, see this 2017 conference paper.)
  9. In August 2018, Canada’s federal government announced its formal adoption of the MBM as its official poverty measure. Its poverty reduction strategy also unveiled a dashboard of poverty-related indicators. This seems very much in line with a position taken by Peter Hicks in a recent blog post, in which he calls for “an evolving ‘dashboard’ of carefully selected indicators would be more useful than a single measure.” The new federal strategy will use the MBM to monitor progress—importantly, it will not use the MBM to determine program eligibility.
  10. Seniors make for an interesting case study here. According to the LIM, a great many seniors in Canada currently experience poverty. But according to the MBM, very few seniors in Canada currently experience poverty. As Andrew Jackson pointed out last year: “There is a huge difference between the LIM and MBM poverty rates for seniors (14.3% vs 5.1% in 2015.)” And this raises an important question: if Canada’s official poverty measure suggests there’s very little seniors’ poverty, to what extent will Canada’s federal government prioritize assistance for seniors?

In sum. The Trudeau government deserves praise for unveiling a dashboard of poverty indicators that will hopefully receive close attention from federal officials in partnership with provincial, territorial and municipal officials, as well as researchers and advocates. Having said that, Ron Kneebone reminds me that the MBM has yet to be formally adopted by provincial or territorial governments. There is also reason to be very concerned about what initiatives may or not be in store for seniors, given that the MBM suggests they currently experience very little poverty.


I wish to thank the following individuals for assistance with this blog post: Miles Corak, Filipe Duarte and his students, Susan Falvo, Reuben Ford, Rob Gillezeau, Seth Klein, Ron Kneebone, Andrew Jackson, Marc Lee, David Macdonald, Michael Mendelson, Allan Moscovitch, Geranda Notten, Charles Plante, Saul Schwartz, Richard Shillington, Vincent St-Martin, John Stapleton, Ricardo Tranjan, and Mike Veall. Any errors are mine.

Saskatchewan budget misses opportunity on rental housing assistance

Saskatchewan budget misses opportunity on rental housing assistance

Saskatchewan budget misses opportunity on rental housing assistance

I recently wrote a ‘top 10’ overview blog post about the 2018 Saskatchewan budget. Following on the heels of that, I’ve now written an opinion piece about the budget’s announcement of a phase out a rental assistance program for low-income households.

Points raised in the opinion piece include the following:

-Across Saskatchewan, rental vacancy rates are unusually high right now, making this a good time to provide rental assistance to tenants for use in private units (indeed, right now it’s a so-called renter’s market in Saskatchewan, meaning it’s a relatively good time for tenants to negotiate rental agreements with private landlords).

-Thus, rather than phasing out the program, it would have been sensible to have expanded it.

-Phasing it out will very possibly lead to more homelessness, which in turn may lead lead to higher public costs elsewhere (especially to the health care sector).

Interestingly, just yesterday the Saskatchewan Landlord Association made many of these same points themselves; they like the rental assistance program, as it increases demand for its members’ housing units (many of which are currently sitting empty).

It’s of course also important for government to finance housing owned by non-profit entities. I recently wrote about the importance of a variety of measures to improve housing affordability in the housing chapter of this year’s Alternative Federal Budget.

Meanwhile, the link to my recent opinion piece is here.

Ten Things to Know About Homelessness in Canada

Ten Things to Know About Homelessness in Canada

Ten Things to Know About Homelessness in Canada

This afternoon I gave a presentation at Raising the Roof’s Child & Family Homelessness Stakeholder Summit in Toronto. My slide deck can be downloaded here. To accompany the presentation, I’ve prepared the following list of Ten Things to Know About Homelessness in Canada.

1.Efforts to enumerate persons experiencing homeless have generally been spotty, but it is reasonable to assert that homelessness in Canada saw substantial growth in the 1980s and 1990s. On a nightly basis in Toronto, there were about 1,000 persons per night staying in emergency shelters in 1980. By 1990, that figure had doubled. And ten years later, there were 4,000 persons per night staying in Toronto’s emergency shelters. The Toronto figure of 4,000 per night has remained relatively constant for the past 15 years, though it has edged up in the aftermath of the 2008-2009 recession a phenomenon which I’ve previously written about here. (Admittedly, the number of persons living in emergency shelters on a nightly basis is a rather narrow gauge of homelessness. According to Canada Mortgage and Housing Corporation, approximately 13% of Canadian households are in core housing need; for Nunavut, the figure is a whopping 39%.)

2. Though it’s difficult to establish causation, I think relatively safe assumptions can be made about some of the major contributors to homelessness. Researchers are generally careful about using the term causation in fact, there are long-standing tensions among academic disciplines as to what methodological approaches are required to establish it. Statisticians, for example, generally believe that randomized controlled trials (RCTs) are needed to establish causation; but as David Freedman has argued, RCTs are often impractical or unethical (Freedman, 1999, p. 255). Rather, careful researchers are more likely to say things like these factors have likely contributed to this effect,” or “I think it’s likely that this effect caused this to happen And with that in mind, I’d like to suggest that there are probably three major factors that have contributed to homelessness in Canada: 1) macroeconomic factors (especially unemployment); 2) changes to our social welfare system (including a decrease in the availability of government-subsidized housing); and 3) the design and administration of policies whose specific intent is to respond directly to homelessness (often referred to as ‘systems responses’ to homelessness).

3. Homelessness has profound ramifications on the lives of children. As I wrote in 2012: Two studies have been done in Toronto looking at the role of housing with respect to children in care. Results of both studies indicate that the state of the family housing was a factor in one in five cases in which a child was temporarily admitted into care. Results from the Toronto research also indicate that, in one in 10 cases, housing status delayed the return home of a child from care (Falvo, 2012, p. 14). Other research estimates that, on an annual basis in Toronto alone, approximately 300 babies are born to mothers who are homeless. (Of course, homelessness can have profound ramifications on the lives of adults as well. For more on this, see this 2007 study.)

4. The role of Canada’s federal government in funding both housing for low-income persons and programming for homeless persons has varied considerably over time. Provinces and territories spend much more of their own money on housing for low-income persons when the federal government leads. Thus, a considerable amount of subsidized housing for low-income Canadians was built from the mid-1960s through to the early 1990s. Since the early 1990s, comparatively little subsidized housing has been built for low-income persons in Canada. I should also note that the annual, inflation-adjusted value of federal funding for homelessness today is worth just 35% of what it was worth in 1999.

5. Not every province/territory responds to homelessness in the same way. While much mores subsidized housing for low-income persons gets built when the federal government leads, provinces and territories don’t always respond to federal funding initiatives in the same way. For example, between 2002 and 2013, three times as many subsidized housing units were built in Alberta (on a per capita basis) than in Ontario. I would argue that a driving force behind this differential stems from Alberta’s strong economic performance during this same period relative to that of Ontario’s.

6. Though a careful researcher will be cautious in discussing what causes homelessness, I think we know a lot about what solves it. In many cases, a person who stays in an emergency shelter will exit homelessness without substantial public resources. In some cases, they might find housing on their own; in other cases, family and friends may provide them with short term assistance e.g. some financial support, a couch to sleep on, etc. (To learn more about lengths of stay in homeless shelters in a sample of Canadian cities, see this 2013 study.) Researchers and advocates for the homeless generally don’t view such short-term stays as a major public policy challenge the bigger challenge is in the case of persons who stay in emergency shelters (and outside) for longer periods of time. Even here though, I would argue that it’s hardly a mystery as to what constitutes an effective policy response.

Indeed, as early as the mid-1980s, small non-profit organizations in Ontario (and possibly in other provinces as well) found success in building subsidized housing for persons who had experienced long-term homelessness they did so by providing professional staff support to help such tenants live independently in those units. This was (and still is) known as supportive housing. The emergence of supportive housing in Ontario happened in large part due to strong advocacy by community-based groups. This included: the Singles Displaced Persons Project; the consumer/survivor movement; the slogan homes not hostels the founding of Houselink Community Homes; and the founding of Homes First Society. Conditions of eligibility for such housing varied from one provider to the next. In many cases, the tenant did not have to prove housing readiness before being offered a unit. In fact, Homes First Society got its name because its founders believed that its tenants needed homes first before addressing other challenges (i.e. mental health, substance use, employment, etc.).

Today, researchers, practitioners and advocates refer to this approach ashousing first. And very recently, a successful RCT of housing first was conducted in five Canadian cities; I’ve previously written about that study here.

7. There are several ways of making housing available to low-income households; all of them involve the private sector to varying degrees. Sometimes when government subsidizes housing for low-income persons, it provides money to a non-profit entity that develops, owns and operates the units. Other times, government provides a subsidy to landlords (either for-profit or non-profit); in exchange for the subsidy, the landlord agree to rent units at a reduced rate for a specified period of time (e.g. in some cases, for 10 years). And other times, government provides money (often known as a housing allowance) to low-income tenants who then rent a unit from a for-profit landlord. Of the three possible approaches, I personally have a preference for the option where a non-profit entity develops, owns and operates the units (and I have previously written about this here). Having said that, I think there’s a place for all three approaches, depending on local context.

8. Some jurisdictions have used sophisticated information management systems as part of their efforts to respond to homelessness. Many organizations serving homeless persons in Calgary enter client information into a database called the Homelessness Management Information System, a system that is also used in many American cities. Client-level information (such as age, health status, employment status and housing status) is entered into the database when an initial intake is done. While the client is receiving services, updated information is entered again; in the case of some programs, follow-up assessments are done every three months. In the case of some program types, there are both exit and post-exit follow-up assessments completed. All information-gathering is subject to provincial privacy legislation. There are many uses for the data once it’s gathered. For example, some organizations use the data to provide case management services to clients. Also, funders are able to assess each organization’s performance against benchmarks (i.e. percentage of clients who receive housing after a specific period of time).

9. When it comes to both preventing and responding to homelessness, the capacity of government to generate revenue matters a great deal.Governments typically use revenue generated from taxation to finance both subsidized housing and other important social programs. When tax revenue decreases, many governments have less ability to spend on such programs. Since the mid-1990s, tax revenue in Canada (measured as a percentage of our Gross Domestic Product) has decreased substantially. If this trend doesn’t reverse itself soon, it will be very challenging for many governments (especially provincial, territorial and municipal governments) to invest in important social programs. There is currently a move afoot by some Canadians to increase taxes; it is led by Alex Himelfarb, former Clerk of the Privy Council. Alex and his son Jordan recently co-edited a book that calls for the need for higher taxation in Canada. (Note: according to some schools of thought, it isn’t necessary for a sovereign government with its own currency to tax more in order to finance more social spending. While keeping in mind that such an approach would be most relevant to Canada’s federal government and much less relevant to provincial, territorial and municipal governments readers can read more about one such school of thought here.)

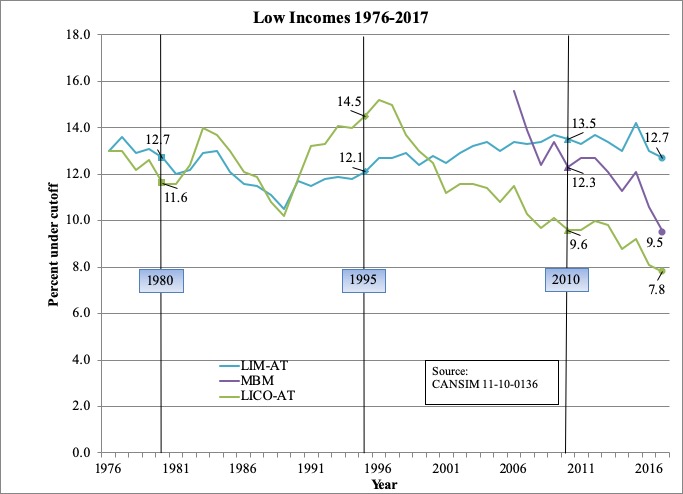
10. Over the course of the next decade, Canada will likely see substantial increases in homelessness among both seniors and Indigenous peoples (First Nation, Metis and Inuit). Seniors and Indigenous peoples are growing as a percentage of Canada’s total population. Further, the percentage of seniors living below Statistics Canada’s Low-Income Measure has grown substantially since the mid-1990s. I think all of this makes it likely that both of these groups will begin to grow as a percentage of Canada’s homeless populations.

The following individuals were very helpful in helping me prepare the present blog post: Maroine Bendaoud, Lisa Burke, George Fallis, Greg Suttor, Francesco Falvo, Louise Gallagher, Ali Jadidzadeh, Lisa Ker, Jennifer Legate, Kevin McNichol, Richard Shillington, Blake Thomas and Mike Veall. Any errors are mine.