Les effets à long terme de la récession de la COVID-19 sur le sans-abrisme au Canada

Les effets à long terme de la récession de la COVID-19 sur le sans-abrisme au Canada

Les effets à long terme de la récession de la COVID-19 sur le sans-abrisme au Canada

An English-language version of this blog post is available here.

J’ai rédigé un rapport pour Emploi et Développement social Canada qui présente les impacts les plus probables de la récession actuelle sur le sans-abrisme. Le rapport complet est disponible (en  anglais) ici.

Voici 10 choses à savoir à ce sujet.

  1. La récession actuelle risque de contribuer au sans-abrisme au Canada, mais plusieurs facteurs influenceront son ampleur. Parmi ceux-ci : le ressentiment des effets de la récession pourrait prendre jusqu’à cinq ans; les nombreux inconnus à l’horizon (par exemple, de potentielles vagues subséquentes de la pandémie, le développement d’un vaccin, la nature de futures prestations); les variantes démographiques d’une communauté à l’autre (notamment en ce qui concerne le marché du travail et le marché immobilier).
  1. L’effet de décalage de cinq ans s’explique en partie par la lutte pour éviter de perdre leur logement. Lorsque les ménages affronteront une perte de revenu ou d’emploi, ils pourraient tenter de négocier des arriérés de loyer avec le propriétaire de leur domicile; ils pourraient aussi emprunter de l’argent à des amis ou à d’autres membres de leur famille. Ils pourraient tenter d’emménager avec des amis, de la famille, ou dans un logement plus abordable. Le système de bienêtre social canadien a également pour effet de retarder les effets de la récession. Par exemple, les prestations d’assurance emploi (et plus récemment la Prestation d’urgence canadienne) peuvent atténuer les effets d’une perte d’emploi, aidant ainsi les ménages à maintenir leurs logements. Même si elle est moins généreuse, l’assurance sociale peut également contribuer à retarder le sans-abrisme.
  1. L’effet de décalage donne aussi la chance aux paliers gouvernementaux supérieurs de prévoir des initiatives contre le sans-abrisme. Puisqu’il pourrait prendre encore quelques années pour que l’on perçoive la croissance du sans-abrisme dû à la récession actuelle, il y a suffisamment de temps pour concevoir, implanter et observer les retombées de nouvelles mesures préventives. Ces nouvelles mesures pourraient cibler des ménages qui risquent de perdre leur logement, ou qui sont nouvellement sans-abris.[1] 
  1. L’impact de la récession variera d’une communauté à l’autre à travers le pays. L’état des marchés immobiliers, des systèmes d’aide financière, et de la planification du sans-abrisme varie à travers le Canada. De plus, les trajets des sans-abris migrant à travers le pays seront difficiles à prévoir au cours des prochaines années. Conséquemment, il sera difficile de prévoir dans quelles communautés et à quel moment surviendra l’augmentation du sans-abrisme. Nous savons par contre que les personnes les plus affectées par la récession de la COVID-19 sont : les jeunes, les femmes, les personnes célibataires et les personnes sans diplôme d’études secondaires.
  1. Afin de tenir compte des nombreux facteurs en jeu, les fonctionnaires doivent surveiller une variété d’indicateurs. Le rapport recommande à EDSC de tenir compte des indicateurs suivants tout au long de la récession : le taux de chômage officiel, la proportion de Canadiens qui tombent sous la Mesure axée sur les conditions du marché (surtout ceux qui tombent sous le seuil de 75%)[2]; les taux d’aide sociale; le cout médian des loyers; le taux d’inoccupation des loyers; la proportion de ménages qui consacre plus de 50% de leur revenu sur l’habitation; les expulsions; et le taux d’occupation quotidien des refuges d’urgence.
  1. Il faudra faire preuve de nuances avec ces données. Autant que possible, il faudra surveiller l’évolution de ces indicateurs depuis le début de la pandémie, ainsi qu’à travers les différentes régions et groupes démographiques précis (par exemple les femmes, les jeunes, les Autochtones, etc.)
  1. Le rapport recommande au gouvernement fédéral d’améliorer l’Allocation canadienne pour le logement (ACL). Cette prestation offre une aide financière aux foyers à faible revenu afin de payer leur loyer. Il est prévu que la moitié de cet argent proviendra du gouvernement fédéral, et que l’autre moitié proviendra des gouvernements provinciaux et territoriaux. L’ACL devait être lancée le 1er avril 2020, cependant, il n’y a que cinq provinces qui ont signé l’entente. Le gouvernement fédéral pourrait augmenter son apport à l’ACL afin d’encourager le restant des provinces et territoires à en faire autant. Par exemple, le gouvernement fédéral pourrait offrir d’assurer les deux tiers ou les trois quarts des couts.
  1. Le rapport recommande également que le gouvernement fédéral fasse preuve de souplesse quant au recouvrement des montants excédentaires de la Prestation canadienne d’urgence (PUC) versés aux prestataires d’aide sociale. Il est nécessaire de souligner ce point vu la confusion considérable entourant le lancement de la PUC. Une telle approche pourrait comprendre un recouvrement partiel chez ces individus (par l’entremise du système d’impôts), et une amnistie totale devrait être considérée dans certains cas. 
  1. Le rapport recommande qu’EDSC mette sur pied une nouvelle source de financement pour le programme Vers un chez-soi (le véhicule principal par lequel le gouvernement fédéral lutte contre le sans-abrisme). Le rapport aborde la réussite d’effets préventifs aux États-Unis à la suite de la récession de 2008-2009, et encourage EDSC à mettre sur pied un programme semblable au Canada. Le programme pourrait mettre de l’avant une aide financière de courte-durée pour les ménages qui sont à risque de perdre leur logement, en train de le perdre, ou qui l’ont perdu récemment. Les cibles pourraient évoluer au fil du temps, à la lumière de changements survenant dans les indicateurs mentionnés précédemment (taux de chômage officiel, proportion des gens avec des revenus inférieurs à la Mesure axée sur les conditions du marché, etc.).
  1. Le rapport propose des changements politiques que pourraient entamer les gouvernements provinciaux et territoriaux. Ceux-ci comprennent une augmentation des prestations d’aide sociale, de rétablir l’admissibilité des gens disqualifiés de l’aide sociale à cause de la PUC, et encourager les refuges d’urgence à prioriser les solutions basées sur le logement.

En résumé, puisque nous sommes conscients que le sans-abrisme risque d’augmenter au Canada en raison de la récession, les paliers gouvernementaux supérieurs doivent limiter les dégâts. S’ils sont bien conçus, les efforts de prévention du sans-abrisme peuvent être plus économiques que des réponses d’urgences postérieures.

J’aimerais remercier Susan Falvo, Michel Laforge et Vincent St-Martin pour leur appui pendant la rédaction de ce billet.

[1] Il est également très important de continuer à adresser le sans-abrisme existant. J’ai écrit à ce sujet ici (billet en anglais).

[2] Pour d’autres informations par rapport à la Mesure axée sur les conditions du marché, lisez ce billet (en anglais).

Les effets à long terme de la récession de la COVID-19 sur le sans-abrisme au Canada

The long-term impact of the COVID-19 Recession on homelessness in Canada

The long-term impact of the COVID-19 Recession on homelessness in Canada

La version française de ce billet se trouve ici.

I’ve written a report for Employment and Social Development Canada (ESDC) that assesses the likely long-term impact of the current recession on homelessness. The link to the report is here.

Here are 10 things to know:

1. The current recession may contribute to rising homelessness across Canada, but that matter is complicated by several factors. Those factors include: a lag effect of up to five years from the time a recession starts until its impact fully plays out; the many unknowns that lie ahead (e.g., whether there will be future waves of the pandemic, when and if a vaccine is developed, what types of new social benefits are announced, etc.); and differences from one community to another (with respect to both the labour market and housing market, for example).

2. A recession’s lag effect stems in part from a strong desire of households to avoid absolute homelessness. When faced with reduced income or outright job loss, a household may try to arrange a rental arrears plan with their landlord; they may also borrow money from family and friends. They may try to move into cheaper housing as well, or move in with family or friends. The lag effect also stems from Canada’s elaborate social welfare system. For example, Employment Insurance (and more recently the Canada Emergency Response Benefit) can cushion the blow from job loss and help households hang on to their housing. Social assistance, while not as generous, can also delay homelessness onset.

3. This lag effect means there is time for senior orders of government to plan homelessness prevention initiatives. Since it could be a few years before we see rising homelessness in some communities as a result of the current recession, there is time for preventive measures to be designed, implemented and to take effect. Those measures could target households that are either at serious risk of becoming homeless or that have just become homeless.[1]

4. The recession’s impact on homelessness will vary from one community to another. Housing markets, income assistance systems and homelessness system planning frameworks vary across Canada. What is more, migration patterns over the next several years will be hard to predict. As a result, it is challenging to say which Canadian communities will see rising homelessness at what junctures in time. We do know that, thus far, the following types of workers in Canada have been most directly affected by the COVID-19 Recession: young people, women, nonmarried persons, and persons without high school accreditation.

5. In order to monitor the many complex factors involved here, policy-makers needs to track various indicators. The report recommends that ESDC track the following indicators as the recession unfolds: the official unemployment rate; the percentage of Canadians falling below the Market Basket Measure (and especially those falling below 75% of the Market Basket Measure);[2] social assistance benefit levels; median rent levels; the rental vacancy rate; the percentage of households with extreme shelter cost burdens; evictions; and average nightly occupancy in emergency shelters.

6. This tracking will require some nuance. As much as possible, such tracking should emphasize both how these indicators have changed since the start of the pandemic, and how this change varies across both geographical areas and specific populations (e.g., women, youth, Indigenous peoples, etc.).

7. The report recommends that the federal government enhance the Canada Housing Benefit (CHB). This benefit provides financial assistance to help low-income households afford rent. It is expected that half of this money will come from the federal government, and the other half from provinces and territories. The CHB was supposed to launch nationally on 1 April 2020; however, just five provinces have formally agreed to terms regarding the CHB. The federal government could increase the value of this benefit, which could encourage other provinces and territories to sign on. For example, the federal government might offer 2/3 or 3/4 cost-sharing.

8. The report also recommends that the federal government take a soft approach to recovering CERB overpayments from social assistance recipients. This is important in light of the considerable confusion that existed as the CERB was being rolled out. Such an approach might include not trying to fully recover the value of the CERB from these individuals (via the tax system). Even complete amnesty should be considered in some cases.

9. The report recommends that ESDC introduce a new funding stream for Reaching Home (i.e., the federal government’s main funding vehicle for homelessness). The report discusses the successful implementation of prevention efforts in the United States following the 2008-2009 Recession, and encourages ESDC to introduce something similar for Canada. A new prevention stream could focus on time-limited financial assistance directed at households who are either still housed (but at risk of becoming homeless), are in the process of losing their housing, or who have just begun to experience absolute homelessness. Targeting can evolve over time, in light of changes seen in the aforementioned indicators (e.g., the official unemployment rate, the percentage of persons with incomes below the Market Basket Measure, etc.).

10. The report identifies policy changes that could be made by provincial and territorial governments. These include increases to social assistance benefit levels, the reinstatement of social assistance eligibility for recipients who became ineligible due to the CERB, and the encouragement of housing-focused practices at emergency shelters.

In sum. Since we know there is serious risk for more homelessness in Canada as a result of the current recession, senior orders of government need to limit the damage. Well-designed prevention efforts can be more cost-effective than emergency responses after the fact.

I wish to thank Susan Falvo and Vincent St-Martin for assistance with this blog post.

[1] It is also very important to continue addressing existing homelessness. I’ve written about that here.

[2] For more on the Market Basket Measure, see this blog post.

Lifting singles out of poverty in Canada

Lifting singles out of poverty in Canada

Lifting singles out of poverty in Canada

I’ve written a report for the Montreal-based Institute for Research on Public Policy making the case for higher social assistance benefit levels for employable single adults without dependants. The link to the report is here.

Here are 10 things to know.

1. In Canada, most employable adult singles without dependants who receive social assistance get less than $10,000/yr. in benefits. This amount of money is ridiculously low (keeping in mind that this figure includes all forms of tax credits received by the recipient). A person with this income must use it to pay for housing, food, transportation and other basic necessities (to see benefit levels in every province and territory, check out Welfare in Canada).

2. In relation to Canada’s official poverty line, social assistance benefit levels for this household group are dismal. ‘Welfare income’—which includes social assistance benefit levels, child benefits and all forms of tax credits—brings couples with two children to between 75% and 95% of the federally-defined poverty line, depending on the province (see figure 1 below). However, welfare income for employable singles without dependants typically comes to about 50% of the poverty line for this particular household type.


3. In most provinces and territories, $10,000 is less than half of what a minimum wage earner would earn in one year working full-time hours. Historically, policy-makers and economists have often been nervous about setting social assistance benefit levels high enough to make paid work unattractive. However, that shouldn’t be a major concern right now in most parts of Canada, as the differential between welfare incomes and minimum wage rates is currently quite substantial.

4. Increases to social assistance benefit levels could help Canada’s federal government achieve its poverty reduction targets. In Canada, we say a household is in ‘deep income poverty’ if it makes less than 75% of the official poverty line. Canada’s Poverty Reduction Strategy, unveiled in October 2018, seeks to track progress on this indicator. Increases in social assistance benefit levels would be a very easy way for progress to be made in this respect.

5. Doing so could also help provincial and territorial governments achieve their poverty reduction targets. All provinces and territories now have their own poverty reduction strategies; many of these strategies include targets pertaining to reducing the number of people under the poverty line (New Brunswick’s strategy actually seeks to reduce deep income poverty by 50%). Increasing social assistance benefit levels would help all provinces and territories achieve their targets.

6. More than half of people in Canada who are in ‘deep income poverty’ are singles. Not only do singles receive very low social assistance benefit levels relative to other household types, but they also do not realize many of the economies of scale that come with cohabitating (e.g., shared rent, shared utility costs, etc.). This reality makes this household group all the more worthy of policy attention.

7. Higher social assistance benefit levels can result in less homelessness. It’s intuitive for many of us that higher social assistance benefit levels would both reduce the likelihood of a person losing their housing and also increase the likelihood of a person experiencing homelessness to obtain rental housing on the private market. Research by Ron Kneebone and Margarita Wilkins confirms this, estimating that a $1,500/yr. increase in social assistance benefits for an employable single without dependants would (in 2011) reduce the use of shelter beds on any given night by nearly 20%.

8. Higher benefit levels can improve food security. A recent study in British Columbia confirms this, finding that overall rates of food security improved among social assistance recipients after a one-time increase in social assistance benefit levels in that province. 

9. Less homelessness and improved food security would almost certainly result in public cost savings. The costs of homelessness to the taxpayer are well documented, as are the healthcare costs associated with food insecurity. Put differently, increasing public expenditure on social assistance would likely result in public savings elsewhere.

10. While higher benefit levels would likely lead to more takeup, this increased takeup would be modest. That is precisely the finding of a recent Canadian study that I co-authored with Ali Jadidzadeh. We found that a 10% increase in the real value of social assistance benefit levels for this same household group would likely result in an increase in caseloads of less than 5%.

In sum. When it comes to social assistance across Canada, employable single adults without dependants are a very neglected subgroup. Increasing their benefit levels would likely result in less poverty, improved food security and less homelessness.


I wish to thank Susan Falvo, Lynn McIntyre, Vincent St-Martin and Val Tarasuk for assistance with this blog post.

Social assistance: Do higher benefit levels lead to higher caseloads?

Social assistance: Do higher benefit levels lead to higher caseloads?

Social assistance: Do higher benefit levels lead to higher caseloads?

I’ve recently co-authored a journal article[1] with Ali Jadidzadeh that asks the question: Do higher social assistance benefit levels lead to greater take-up? The short answer is yes, but that doesn’t mean we shouldn’t increase benefit levels.

Here are 11 things to know about the study.

1. The study looks only at employable adult singles without dependants. Other studies asking the same question have looked at other household groups; but ours focuses on single adults without dependants in part because this group receives very little public policy attention, and in part because they comprise most persons experiencing absolute homelessness in Canada.

2. While the study measures the impact of a variety of independent variables on caseloads, the one we were most interested in was benefit levels. Other independent variables considered in the study are: the official unemployment rate; ‘working poor’ income (e.g., third and fourth decile income); population variation over time; and social assistance rule changes.

3. The study uses three alternative models to estimate the impact of these variables. Essentially, different measurement techniques have their strengths and weaknesses, so it’s common for statistical work like this to use a variety of approaches so that the reader can compare findings.

4. The first model finds an important relationship between benefit levels and caseload growth. Specifically, it finds that a 1% increase in the real (i.e., inflation-adjusted) value of benefit levels results in a 0.372% increase in caseloads. This model uses pooled Ordinary Least Squares (OLS), an approach that doesn’t account for provincial fixed effects (i.e., characteristics of provinces that don’t vary over time). These results should therefore be taken less seriously than the other two models.

5. The second model finds a rather modest relationship between increases in benefit levels and caseload growth. Specifically, it finds that a 1% increase in the real value of benefit levels results in just a 0.157% increase in caseloads. This approach uses fixed effects OLS, meaning it accounts for unobservable provincial characteristics.

6. The third model finds the relationship to be a bit stronger. This approach uses Panel Fully Modified OLS and finds a 1% increase in the real value of benefit levels to result in a 0.457% increase in caseloads. This approach is considered good when researchers want to study long-run relationships between continuous (i.e., quantifiable) variables. It’s a relatively new approach that has gained currency in the past five years.

7. There’s an important takeaway from this. Specifically, a 10% increase in the real value of social assistance benefit levels would likely result in caseload growth for this group of between 1.57% and 4.57%. Many observers would consider this to be modest caseload growth.

8. Rule changes are important, but they are difficult to measure. In the mid-1990s, several large provinces introduced strict eligibility criteria (including the introduction of work-for-welfare provisions). The study finds their impact in reducing caseloads to be statistically significant. However, in general, it is very challenging for statistical analysis to measure the impact of rule changes on caseloads.

9. The unemployment rate has a modest impact on caseloads. In the first model, a one percentage point decrease in the unemployment rate is found to be associated with a 7.3% drop in caseloads (in the second model, it’s associated with a 5.8% drop). One implication from this is that provincial and territorial officials should not expect job creation alone to wipe out social assistance caseloads for employable singles.

10. The study cautions policymakers against focusing too much on the sizes of caseloads. In other words, when deciding on the appropriate levels of benefits, the study encourages policymakers to consider positive outcomes associated with higher benefit levels.

11. Higher social assistance benefit levels can help accomplish other policy objectives. As the study points out, they can reduce the percentage of Canadians living in poverty, reduce levels of food insecurity, improve health outcomes and reduce homelessness (all of which can result in savings of their own to the taxpayer). So if higher benefit levels also result in modest caseload growth, that may not be so bad. 

In sum. There are many positive outcomes associated with higher social assistance benefit levels. Having said that, when policymakers decide to increase benefit levels, they should budget for some increased take-up.

I wish to thank the following individuals for assistance with this blog post: Susan Falvo, Ali Jadidzadeh, Richard Shillington and Vincent St-Martin.

[1] For a full copy of the article, please email me at falvo.nicholas@gmail.com.

Social assistance: Do higher benefit levels lead to higher caseloads?

Ten things to know about poverty measurement in Canada

Ten things to know about poverty measurement in Canada

On October 29, I gave a guest presentation to Professor Filipe Duarte’s master’s seminar class at the University of Windsor. The topic of my presentation was poverty measurement in Canada.

Here are 10 things to know.

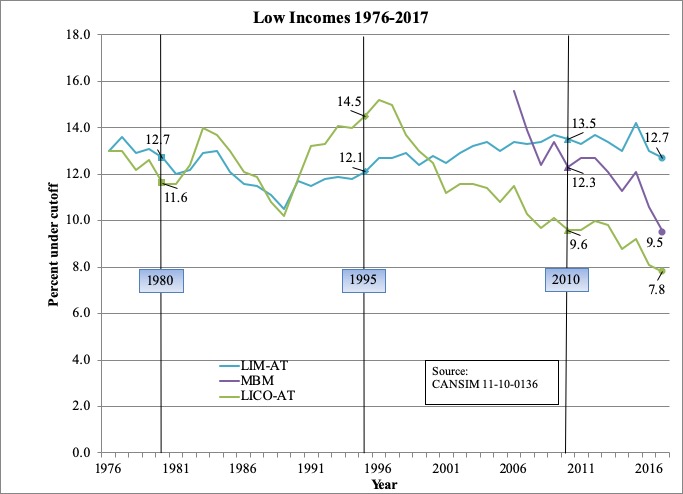
  1. Use of the Low-Income Cut-Off (LICO) would suggest that poverty in Canada has decreased dramatically since the mid-1990s. LICO focuses on the amount of money spent by a family on ‘necessities’ (i.e., housing, food and clothing) as determined by a group of federal public servants. If a family is spending a substantially higher percentage of their income on such necessities—e.g., 20 percentage points higher than the average Canadian family—then the family in question falls below the LICO. The LICO was supposed to be recalculated on a regular basis to reflect changes in spending patterns, but that hasn’t happened since 1992 and is one likely reason for the reduction in poverty shown by this measure (having said that, the LICO has been adjusted each year for inflation). Today, very few experts take the LICO seriously.
  2. Use of the Low Income Measure (LIM) would suggest that poverty in Canada has seen mild fluctuations since the mid-1990s. LIM’s focus is on the family’s income, not on what they spend. A family whose income is below 50% of the national median income (adjusted for family size) is said to be poor according to this measure. LIM, in effect, measures income inequality among the bottom half of income earners. The LIM is useful for international comparisons (though it is far from perfect in that regard, as it looks only at income, not the availability of social programs). 
  3. Use of the Market Basket Measure (MBM) suggests that Canada has seen a major decrease in poverty over the past decade. With the MBM, public officials figure out the cost of a basket of goods and services they feel is sufficient for a standard of living “between the poles of subsistence and social inclusion.” Calculations are then made about how much such a basket costs (the cost of this basket has been estimated for 50 regions across Canada). The content of this basket is periodically adjusted, the last time being in 2011, and its value gets adjusted each year for inflation. If you’re poor according to the MBM, it’s because experts believe you could not afford that basket of goods in your community.

    Visual courtesy of Kevin Milligan.

  4. One of the LICO’s shortcomings is that it doesn’t do a good job of accounting for regional variations in the cost of living across Canada. The LICO (as mentioned above) also hasn’t been adjusted since 1992, meaning that it doesn’t currently account for how much things cost today or what people spend money on today (as Andrew Jackson notes, it doesn’t include the cost of Internet). Finally, LICO doesn’t easily allow for international comparisons. 
  5. One of the LIM’s shortcomings is that it can suggest that recessions are good for poverty reduction. As Alain Noël notes, the LIM is “sensitive to changes in the median income, which sometimes produces counterintuitive results. In a recession, for example, when the median income is flat, the poverty rate may seem to be decreasing while unemployment and economic hardship are increasing.” What’s more, the fact that LIM is based on national median income—as opposed to the median income for the province or territory in question—seems arbitrary to many. Indeed, Professor Noël further notes that “real median incomes vary considerably from one province to another.”
  6. Of the three major indicators, my own preference is the LIM. First, it avoids the inherent challenge of deciding what constitutes an appropriate a basket of goods and services in a country of 37 million people, spanning 10 million km2 and six time zones. Second, I think relativity is what’s really important here—if median income across Canada is increasing, then so too should everyone’s (and vice versa). Third, the LIM lends itself well to international comparisons. I’d like to see it calculated based on national median income for international comparisons, and also based on median income for the economic region in question, in order to provide a more meaningful number.
  7. The debate within Canada has largely ignored the need for indicators of assets. This point has been made by David Rothwell and Jennifer Robson, who note that income and assets are not always correlated. For example, a low-wage worker might have an income that brings them above the LIM, but they may also have $75,000 in student loans and credit card debt. Conversely, a senior could be relying exclusively on Old Age Security as a source of income while also owning a $2 million home outright. (Monitoring asset poverty might put pressure on provincial and territorial officials to stop discouraging asset accumulation among social assistance recipients.)
  8. It’s also important to directly measure material deprivation. For example, core housing need measures the affordability, suitability and adequacy of a person’s housing. Likewise, food insecurity measurement directly assesses the inadequacy or insecurity in access to food due to financial challenges. It’s also important to assess who has access to high-quality childcare and prescription medication. (For a critical analysis of the need to directly measure material deprivation, see this 2017 conference paper.)
  9. In August 2018, Canada’s federal government announced its formal adoption of the MBM as its official poverty measure. Its poverty reduction strategy also unveiled a dashboard of poverty-related indicators. This seems very much in line with a position taken by Peter Hicks in a recent blog post, in which he calls for “an evolving ‘dashboard’ of carefully selected indicators would be more useful than a single measure.” The new federal strategy will use the MBM to monitor progress—importantly, it will not use the MBM to determine program eligibility.
  10. Seniors make for an interesting case study here. According to the LIM, a great many seniors in Canada currently experience poverty. But according to the MBM, very few seniors in Canada currently experience poverty. As Andrew Jackson pointed out last year: “There is a huge difference between the LIM and MBM poverty rates for seniors (14.3% vs 5.1% in 2015.)” And this raises an important question: if Canada’s official poverty measure suggests there’s very little seniors’ poverty, to what extent will Canada’s federal government prioritize assistance for seniors?

In sum. The Trudeau government deserves praise for unveiling a dashboard of poverty indicators that will hopefully receive close attention from federal officials in partnership with provincial, territorial and municipal officials, as well as researchers and advocates. Having said that, Ron Kneebone reminds me that the MBM has yet to be formally adopted by provincial or territorial governments. There is also reason to be very concerned about what initiatives may or not be in store for seniors, given that the MBM suggests they currently experience very little poverty.


I wish to thank the following individuals for assistance with this blog post: Miles Corak, Filipe Duarte and his students, Susan Falvo, Reuben Ford, Rob Gillezeau, Seth Klein, Ron Kneebone, Andrew Jackson, Marc Lee, David Macdonald, Michael Mendelson, Allan Moscovitch, Geranda Notten, Charles Plante, Saul Schwartz, Richard Shillington, Vincent St-Martin, John Stapleton, Ricardo Tranjan, and Mike Veall. Any errors are mine.

Ten Things to Know About Social Assistance in Alberta

Ten Things to Know About Social Assistance in Alberta

Ten Things to Know About Social Assistance in Alberta

This is part two of a two-part blog series on social assistance. Part one, which looks at social assistance across Canada, can be accessed here.

As recently noted by my colleague Rachel Campbell, last fall’s Point-in-Time (PiT) Count of persons experiencing homelessness across Alberta yielded interesting findings pertaining to social assistance. The report found that a mere 7% of persons experiencing homelessness in Calgary indicated that “welfare/income assistance” was one of their sources of income; across the rest of Alberta, meanwhile, the average was 29%.

On April 20, Calgary Homeless Foundation convened a community panel discussion in the hope of uncovering potential reasons for this discrepancy. Panel members were Andrew Joo (Calgary Drop-In), Simon Lai (Woods Homes) and Ellie Hall (Calgary Legal Guidance).[1]

Here are 10 things to know:

  1. It’s always been challenging for households to qualify for—and maintain—social assistance in Alberta. Major reasons for this include: governments wanting to spend less money, policy makers fearing that social assistance receipt will make gainful employment less attractive, and elected officials (and their constituents) believing that unemployed persons have themselves to blame for their misfortune. (None of these points are limited to Alberta; all of this was discussed in Part 1 of the present blog series.)
  2. In 1986, the Edmonton Social Planning Council published a controversial document. The Other Welfare Manual was an advocacy document that helped low-income individuals (and their advocates) navigate Alberta’s social assistance system. It was updated multiple times and soon became controversial, in part because it made it more challenging for social assistance officials to deny benefits to households. Intake workers were told by their supervisors that they could refuse to see clients who wanted to bring the manual into the intake interview.
  3. In the 1990s, rules for social assistance receipt in Alberta became harsher and benefit levels were reduced. Social assistance administrators began to put an intense focus on ensuring recipients looked for gainful employment. It subsequently became more difficult for people to be deemed eligible for social assistance. As I’ve written before: “a ‘single employable adult’ without dependents received almost $9,000 annually in 1992 (that figure includes tax credits); by 2007, this figure had shrunk to less than $6,000.”[2]
  4. Since that time, it’s been even more difficult for people to access social assistance throughout the province. For example, previously mothers were not considered “employable” until their youngest child was in school. This policy changed to a policy stipulating that mothers should look for work as soon as their youngest child turned two. According to Ellie Hall (Calgary Legal Guidance): “Until recently [when Alberta Works was in the news for forcing clients to stand in the cold waiting in line for an appointment with an intake worker] clients could not schedule an intake appointment. They could only start lining up outside the office, sometimes for hours, and were still often turned away and told to come back another day and start over” (personal communication, May 2, 2017).
  5. Across Alberta municipalities, it’s possible that there are discrepancies in the way social assistance offices interpret rules and administer benefits. Clients and front-line workers often report that rules are not always interpreted consistently across offices. It may be that some Calgary offices are stricter in dealing with persons experiencing homelessness than are offices in other Alberta cities (such inter-office variability may also exist in Canada’s other provinces and territories.)
  6. In Alberta, persons experiencing homelessness are not eligible to receive certain forms of social assistance. They can qualify for Assured Income for the Severely Handicapped (AISH), but not for Alberta Works; the former is for persons with permanent, severe disabilities, while the latter is not (yet, both are forms of social assistance). At one time, individuals living in a homeless shelter could access some Alberta Works benefits money each month; but today, they receive nothing directly from Alberta Works until they find a permanent address (however, the services provided to them by the shelter likely benefit from some provincial funding). This is not the case in all provinces. For example, Quebec lets clients in homeless shelters access the equivalent of Alberta Works.
  7. Earlier this year, the Alberta government streamlined the AISH application process. More information on these changes can be found here (and a CBC News story can be found here). This move happened in response to criticism from the provincial auditor general. However, it’s not yet clear how much of an impact this will have in practice or how it will impact people experiencing homelessness. It’s also important to note that AISH benefit levels are higher than comparable programs in other provinces; see point #8 of this previous post.
  8. Even though the cost of rental housing is substantially higher in Calgary than in other Alberta municipalities, social assistance benefit levels are the same across the entire province. One possible reason for this is that the cost of rent should not be the only variable used to assess cost of living—other important variables include the cost of transportation, food and fuel (and in some Alberta communities, those costs may be greater than in Calgary).[3] In other provinces and territories, benefit levels do vary by jurisdiction, in part to reflect the higher cost of living in more remote areas of that province or territory. This is the case in Ontario, Manitoba, Saskatchewan and all three territories.[4] In this recent presentation, Ron Kneebone and Margarita Wilkins argue that social assistance benefits levels in Alberta should vary by municipality.
  9. When it comes to the percentage of each city’s homeless population receiving social assistance, one factor that may help explain the discrepancy between Calgary and the rest of Alberta may be labour market attachment. As Rachel Campbell noted in her recent blog post, results of last fall’s PiT Count found a discrepancy between Calgary and the rest of Alberta in terms of individuals experiencing homelessness indicating “employment” as a source of income. In Calgary, 33% of respondents indicated “employment” as a source of income, compared with fewer than 10% in the rest of the province. Since it’s harder for persons who are gainfully employed to receive social assistance, it would be logical if this explains much of the discrepancy between rates of social assistance receipt among persons experiencing homelessness in Calgary versus other Alberta cities.
  10. Today, the Alberta government is under considerable political pressure to control spending. For 2017-18, the provincial government is forecasting a $10.3 billion deficit. And for 2018-19, its target is a $9.7 billion deficit. At the same time, the job vacancy picture looks bleak, and social assistance caseloads are rising (you can read about this here and here).

In Sum.  The question asked at the outset of this two-part blog series was: “Why do a smaller percentage of persons experiencing homelessness in Calgary receive social assistance than their counterparts in other Alberta cities?” I offer three possible answers to this question: 1) It’s always been difficult for anyone to access social assistance in Alberta, as is the case in every Canadian province and territory; 2) higher rates of employment among people experiencing homelessness in Calgary may explain why a smaller percentage of Calgary’s homeless population accesses social assistance; and 3) variations in how staff from one office to another interpret social assistance eligibility rules may also help explain the discrepancy between Calgary and other cities.

The author wishes to thank the following individuals for invaluable assistance with this blog post:  Rachel Campbell, Hilary Chapple, Louise Gallagher, Ellie Hall, Coleen Hutton, Andrew Joo, Nigel Kirk, Kara Layher, Lindsay Lenny, John Stapleton, Anne Tweddle, Donna Wood and one anonymous reviewer. Any errors lie with the author.

You can view a PDF version of this blog post here: Ten Things to Know About Social Assistance in Alberta


[1] Multiple attempts were made—via official channels—to have a Government of Alberta official also participate on the panel. Regrettably, none of those attempts proved fruitful.

[2] All of these figures are expressed in 2015 constant dollars.

[3] For a succinct overview of a recent attempt to calculate the cost-of-living variation across Alberta communities, see this report; and for more detail, see this web link.

[4] In the words of my colleague, John Stapleton: “I don’t think any jurisdiction has a good rationale for its rates. They are historical rather than rational and reflect a massive elixir of compounds that seldom make sense. Every so often, a province or territory will compare and set rates according to some external standard like the consumer price index or cost of items. It seldom lasts long” (personal communication, April 30, 2017).