Ten things to know about poverty measurement in Canada

Ten things to know about poverty measurement in Canada

Ten things to know about poverty measurement in Canada

On October 29, I gave a guest presentation to Professor Filipe Duarte’s master’s seminar class at the University of Windsor. The topic of my presentation was poverty measurement in Canada.

Here are 10 things to know.

  1. Use of the Low-Income Cut-Off (LICO) would suggest that poverty in Canada has decreased dramatically since the mid-1990s. LICO focuses on the amount of money spent by a family on ‘necessities’ (i.e., housing, food and clothing) as determined by a group of federal public servants. If a family is spending a substantially higher percentage of their income on such necessities—e.g., 20 percentage points higher than the average Canadian family—then the family in question falls below the LICO. The LICO was supposed to be recalculated on a regular basis to reflect changes in spending patterns, but that hasn’t happened since 1992 and is one likely reason for the reduction in poverty shown by this measure (having said that, the LICO has been adjusted each year for inflation). Today, very few experts take the LICO seriously.
  2. Use of the Low Income Measure (LIM) would suggest that poverty in Canada has seen mild fluctuations since the mid-1990s. LIM’s focus is on the family’s income, not on what they spend. A family whose income is below 50% of the national median income (adjusted for family size) is said to be poor according to this measure. LIM, in effect, measures income inequality among the bottom half of income earners. The LIM is useful for international comparisons (though it is far from perfect in that regard, as it looks only at income, not the availability of social programs). 
  3. Use of the Market Basket Measure (MBM) suggests that Canada has seen a major decrease in poverty over the past decade. With the MBM, public officials figure out the cost of a basket of goods and services they feel is sufficient for a standard of living “between the poles of subsistence and social inclusion.” Calculations are then made about how much such a basket costs (the cost of this basket has been estimated for 50 regions across Canada). The content of this basket is periodically adjusted, the last time being in 2011, and its value gets adjusted each year for inflation. If you’re poor according to the MBM, it’s because experts believe you could not afford that basket of goods in your community.
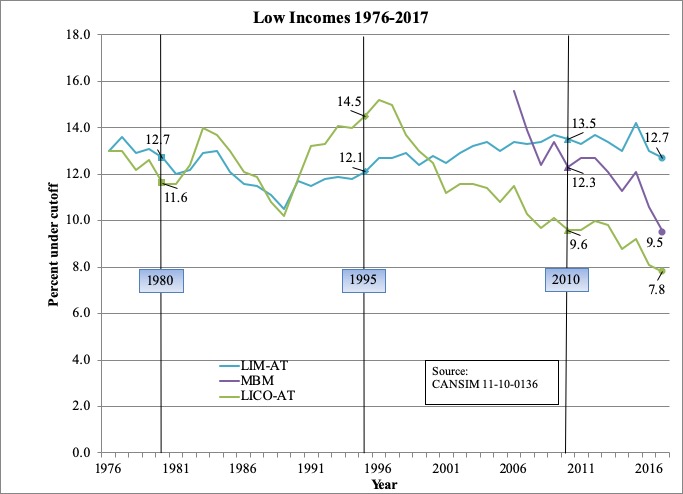
    Visual courtesy of Kevin Milligan.

  4. One of the LICO’s shortcomings is that it doesn’t do a good job of accounting for regional variations in the cost of living across Canada. The LICO (as mentioned above) also hasn’t been adjusted since 1992, meaning that it doesn’t currently account for how much things cost today or what people spend money on today (as Andrew Jackson notes, it doesn’t include the cost of Internet). Finally, LICO doesn’t easily allow for international comparisons. 
  5. One of the LIM’s shortcomings is that it can suggest that recessions are good for poverty reduction. As Alain Noël notes, the LIM is “sensitive to changes in the median income, which sometimes produces counterintuitive results. In a recession, for example, when the median income is flat, the poverty rate may seem to be decreasing while unemployment and economic hardship are increasing.” What’s more, the fact that LIM is based on national median income—as opposed to the median income for the province or territory in question—seems arbitrary to many. Indeed, Professor Noël further notes that “real median incomes vary considerably from one province to another.”
  6. Of the three major indicators, my own preference is the LIM. First, it avoids the inherent challenge of deciding what constitutes an appropriate a basket of goods and services in a country of 37 million people, spanning 10 million km2 and six time zones. Second, I think relativity is what’s really important here—if median income across Canada is increasing, then so too should everyone’s (and vice versa). Third, the LIM lends itself well to international comparisons. I’d like to see it calculated based on national median income for international comparisons, and also based on median income for the economic region in question, in order to provide a more meaningful number.
  7. The debate within Canada has largely ignored the need for indicators of assets. This point has been made by David Rothwell and Jennifer Robson, who note that income and assets are not always correlated. For example, a low-wage worker might have an income that brings them above the LIM, but they may also have $75,000 in student loans and credit card debt. Conversely, a senior could be relying exclusively on Old Age Security as a source of income while also owning a $2 million home outright. (Monitoring asset poverty might put pressure on provincial and territorial officials to stop discouraging asset accumulation among social assistance recipients.)
  8. It’s also important to directly measure material deprivation. For example, core housing need measures the affordability, suitability and adequacy of a person’s housing. Likewise, food insecurity measurement directly assesses the inadequacy or insecurity in access to food due to financial challenges. It’s also important to assess who has access to high-quality childcare and prescription medication. (For a critical analysis of the need to directly measure material deprivation, see this 2017 conference paper.)
  9. In August 2018, Canada’s federal government announced its formal adoption of the MBM as its official poverty measure. Its poverty reduction strategy also unveiled a dashboard of poverty-related indicators. This seems very much in line with a position taken by Peter Hicks in a recent blog post, in which he calls for “an evolving ‘dashboard’ of carefully selected indicators would be more useful than a single measure.” The new federal strategy will use the MBM to monitor progress—importantly, it will not use the MBM to determine program eligibility.
  10. Seniors make for an interesting case study here. According to the LIM, a great many seniors in Canada currently experience poverty. But according to the MBM, very few seniors in Canada currently experience poverty. As Andrew Jackson pointed out last year: “There is a huge difference between the LIM and MBM poverty rates for seniors (14.3% vs 5.1% in 2015.)” And this raises an important question: if Canada’s official poverty measure suggests there’s very little seniors’ poverty, to what extent will Canada’s federal government prioritize assistance for seniors?

In sum. The Trudeau government deserves praise for unveiling a dashboard of poverty indicators that will hopefully receive close attention from federal officials in partnership with provincial, territorial and municipal officials, as well as researchers and advocates. Having said that, Ron Kneebone reminds me that the MBM has yet to be formally adopted by provincial or territorial governments. There is also reason to be very concerned about what initiatives may or not be in store for seniors, given that the MBM suggests they currently experience very little poverty.


I wish to thank the following individuals for assistance with this blog post: Miles Corak, Filipe Duarte and his students, Susan Falvo, Reuben Ford, Rob Gillezeau, Seth Klein, Ron Kneebone, Andrew Jackson, Marc Lee, David Macdonald, Michael Mendelson, Allan Moscovitch, Geranda Notten, Charles Plante, Saul Schwartz, Richard Shillington, Vincent St-Martin, John Stapleton, Ricardo Tranjan, and Mike Veall. Any errors are mine.
Ten things to know about Canadian attempts to count homelessness through Point-in-Time Counts

Ten things to know about Canadian attempts to count homelessness through Point-in-Time Counts

Ten things to know about Canadian attempts to count homelessness through Point-in-Time Counts

Alberta’s seven largest municipalities recently released early results of a provincially-coordinated effort to enumerate and survey persons experiencing homelessness. Most of these communities reported reductions in homelessness, and reported a 19% reduction in province-wide homelessness compared to the first provincially-coordinated count conducted in 2014. The stated purpose of a Point-in-Time Count (PIT Count) is to provide a current snapshot of the demographics and number of people experiencing homelessness within a specific timeframe. Across Canada, these types of exercises have been going on for years—but they’re not always what they seem. Here are 10 things to know.
  1. Local officials already keep basic information about persons sleeping in emergency shelters and other provisional housing; but they typically have very little information about persons sleeping outside. Across Canada, most urban centres keep administrative data on persons experiencing homelessness. Indeed, local officials (often municipal government staff) keep tabs on how many people are sleeping in their emergency shelters; officials also typically know some demographic information about those persons. From time to time, communities also conduct Point in Time (PIT) Counts (i.e. ‘PIT Counts’) which seek not only to survey and count persons sleeping in emergency shelters, but also to survey and count persons sleeping outside. The recently-conducted 7 Cities PIT Count in Alberta PIT gathered data and survey information from emergency shelters, short-term and interim housing, corrections facilities, and persons outside.
  2. For more than a decade, there have been communities in Canada conducting counts of homelessness in their community (i.e. ‘PIT Counts’). Each community has used its own methodological approach, and that methodological approach often changes from year to year, all of which can impact or skew a count. According to a guide prepared by Employment and Social Development Canada: “Differences include the time of year the count is conducted, the time of day the count happens, the people that are included as ‘homeless,’ and the questions that are asked in the survey.” Other factors that can skew the result of a count include weather conditions on the night of the count and changes in the locations within a city where people experiencing homelessness are known to sleep without interference from law enforcement. Unlike data on people experiencing homelessness kept on a day-to-day basis by social workers and other front-line professionals (which I’ve previously blogged about here), data gathered through PIT Counts typically include a strong focus on rough sleepers (i.e. persons sleeping outside on the night of the count).
  3. In 2016, there was a national effort to coordinate PIT Counts across Canada. During this effort, 31 communities participated, spanning seven provinces and one territory. Each of these communities did their counts between January 1 and April 30. For many communities, this was the first time they’d done a PIT Count. Everyone used the same group of core questions. Training workshops were held in November 2015 and in early 2016. A module was created by Employment and Social Development Canada (ESDC), and the Canadian Observatory on Homelessness created a toolkit. The report with findings from the 2016 national effort will likely be released by ESDC in the near future.
  4. Canada’s most populous cities chose not to participate in the 2016 nationally-coordinated effort. One reason some cities chose not to participate in the nationally-coordinated effort was that the time of year chosen was not ideal for them. It’s hard for some communities to find volunteers when it’s cold outside. And although communities counting as late as April were ultimately included in the national effort, the original time frame chosen by the federal government was in the dead of winter. Another reason many cities chose not to participate is that counting homeless persons when it’s extremely cold outside runs the risk of under-counting rough sleepers. Finally, some cities had done their previous count just a short period earlier, so an early-2016 count would not have been practical. Cities choosing not to participate in the nationally-coordinated effort include: Toronto, Montreal, Vancouver, Calgary, Edmonton, Ottawa and Winnipeg. (As mentioned above, however, at the provincial level Alberta’s seven major cities did participate in Canada’s first provincially-coordinated PIT Count in October of 2014 with a commitment to count again in October of 2016.)
  5. PIT Counts combine research and advocacy—and that can be messy. Researchers and policy-makers find it helpful to have accurate data about homeless populations. However, local officials wanting to demonstrate progress in “ending homelessness” sometimes see the results of PIT Counts as ‘progress reports.’ This can create a tension between those wanting accuracy, on the one hand, with those wanting to present an ongoing picture of progress to all stakeholders. Some local officials responsible for undertaking PIT Counts are therefore in a conflict of interest situation. (Remember: local communities decide what kind of methodology to use and how to change their methodology from one year to the next. Communities intent on demonstrating progress in “ending homelessness” may find it tempting to adjust methodologies to create opportunities to present a lower ‘final number’ than previously announced…)
  6. Officials in some communities may (quietly) hope they end up with a smaller ‘count size;’ officials in other communities may (quietly) hope to end up with a larger ‘count size.’ Admittedly, not every community takes the same approach to advocacy. While many want to ‘show progress’ by ending up with a smaller number of individuals enumerated, others may want to end up with a larger number (in order to show funders that further resources are needed in order to end homelessness). This may depend on whether local officials choose a ‘glass half full’ approach to advocacy or a ‘glass half empty’ approach. (I discuss both of these approaches in this previous blog post.)
  7. One challenge with PIT Counts is the need to balance methodological consistency and rigour, on the one hand, with community flexibility and need, on the other. As I’ll discuss in point #9 below, Statistics Canada could potentially be resourced to assist with future PIT Counts; this might result in more methodological consistency across years and across jurisdictions. However, many Canadian cities have an established methodology that works for their community that has been developed over many years. This allows for year over year comparisons within the community but limited comparisons across jurisdictions. As well, these communities often have a very well-organized network of volunteers who support their endeavours and use the PIT Count as an opportunity to raise awareness of homelessness in the community through media engagement and opportunities to involve political leadership in the count.
  8. I think an unresolved methodological question with PIT Counts is whether the outdoor (i.e. rough sleeper) component of a community’s PIT Count results should be interpreted as being representative of that community’s outdoor homeless population.In other words, if 20% of homeless persons enumerated outside in Toronto’s PIT Count are over the age of 65, is it reasonable to infer from this that 20% of Toronto’s actual outdoor homeless population is also over the age of 65? I think most people who read results of PIT Counts have a tendency to assume that the results for most cities are representative; but careful researchers will acknowledge that this may not always be the case. I think the more confident enumerators are that most regions of their city with rough sleepers have been covered in a PIT Count, the more reasonable it is to infer that that city’s PIT Count results are indeed representative of that city’s actual homeless population.
  9. The federal government could add methodological rigour to PIT Counts by asking Statistics Canada to assist with a federally-coordinated PIT Count effort. Indeed, ESDC could fund Statistics Canada to develop a methodology and train volunteers to conduct a survey that would seek to be representative of each community’s homeless population. Under this scenario, volunteers trained by Statistics Canada officials would conduct face-to-face interviews with persons experiencing homelessness. This survey could be done yearly and, once complete, an aggregation of the data collected could be made available at the CANSIM web site. A key advantage of Statistics Canada being involved is that survey design and administration is their area of expertise. Under this approach, there would be one common methodology used to collect data across Canada (rather than several dozen, as is currently the case) and this would allow for comparisons across jurisdictions and across time. This could also help address the potential conflict of interest situation discussed in point #5 above—indeed, Statistics Canada officials would ensure (if not require) methodological consistency across communities.
  10. There are several advantages to the status quo approach. In addition to the advantages mentioned in point #7 above (pertaining to volunteer recruitment), another advantage of the status quo approach is community control. Indeed, under the existing system (whereby each community conducts its own count) if local organizers want to add new questions or rephrase existing ones, they can do so at their own discretion.
Going forward. In 2018, the federal government will once again attempt a nationally-coordinated PiT Count. Participating communities will be asked to conduct their counts in either March or April that year. Each participating community will also receive funding from ESDC to use toward the effort. More information on the “second Canadian coordinated homeless count” can be found here. To download a PDF version of this document click HERE. ______________________________________________________

The following persons provided invaluable assistance in the preparation of this blog post: Robbie Brydon, Rachel Campbell, Wally Czech, Jesse Donaldson, Louise Gallagher, Darcy Halber, Patrick Hunter, Nicole Jackson, Ali Jadidzadeh, Lindsay Lenny, Kevin McNichol, Adam Melnyk, Tim Richter, John Rowland and Munir Sheikh. The views expressed in this blog post are those of the author, and not necessarily those of the Calgary Homeless Foundation. Any errors lie with the author.